. 2007 Nov 26;204(12):2977-87.
doi: 10.1084/jem.20070366. Epub 2007 Nov 6.

Phosphoinositide 3-kinase gamma participates in T cell receptor-induced T cell activation

Affiliations

Phosphoinositide 3-kinase gamma participates in T cell receptor-induced T cell activation

Isabela Alcázar et al. J Exp Med. .

Abstract

Class I phosphoinositide 3-kinases (PI3Ks) constitute a family of enzymes that generates 3-phosphorylated polyphosphoinositides at the cell membrane after stimulation of protein tyrosine (Tyr) kinase-associated receptors or G protein-coupled receptors (GPCRs). The class I PI3Ks are divided into two types: class I(A) p85/p110 heterodimers, which are activated by Tyr kinases, and the class I(B) p110gamma isoform, which is activated by GPCR. Although the T cell receptor (TCR) is a protein Tyr kinase-associated receptor, p110gamma deletion affects TCR-induced T cell stimulation. We examined whether the TCR activates p110gamma, as well as the consequences of interfering with p110gamma expression or function for T cell activation. We found that after TCR ligation, p110gamma interacts with G alpha(q/11), lymphocyte-specific Tyr kinase, and zeta-associated protein. TCR stimulation activates p110gamma, which affects 3-phosphorylated polyphosphoinositide levels at the immunological synapse. We show that TCR-stimulated p110gamma controls RAS-related C3 botulinum substrate 1 activity, F-actin polarization, and the interaction between T cells and antigen-presenting cells, illustrating a crucial role for p110gamma in TCR-induced T cell activation.


Figures

Figure 1.
Figure 1.
Impaired in vitro proliferation of p110γ−/− T cells. (A) Peripheral T cells (CD3+) were purified from p110γ−/− and p110γ+/− mice and activated in wells coated with anti-CD3 or anti-CD3 plus anti-CD28, alone or with 10 U/ml IL-2. Proliferation was determined at 48 h. Means ± SD are shown for at least three experiments. *, P ≤ 0.05; **, P ≤ 0.01. (B) For long-term in vitro expansion, p110γ−/− and p110γ+/− peripheral T cells were activated in anti-CD3–coated wells (day 0) for 24 h; at day 1, cells were removed from antibody and 10 U/ml IL-2 was added. The total cell number was counted daily. Means ± SD are shown for three experiments (P ≤ 0.01). (C and D) Proliferation of purified CD4+ (C) or CD8+ (D) T cells from p110γ−/− and p110γ+/− mice, as in A. *, P ≤ 0.05; **, P ≤ 0.01. NA, not activated.
Figure 2.
Figure 2.
p110γ is activated by TCR engagement. (A) Purified T cells from WT mice were activated with anti-CD3 plus anti-CD28 for different times. p110γ was immunoprecipitated from total cell lysate, and its lipid kinase activity was determined in vitro. Lipids were resolved by TLC and visualized by autoradiography. Anti-p110γ was used in Western blots to control equal amounts of p110γ in the different extracts. The histogram represents the x-fold increase (means ± SD) of the PIP3 signal (quantitated using ImageJ) at different time points (t) compared with that obtained at t = 0. (B) Lipid kinase activity as in A was determined in purified CD4+ and CD8+ T cells from WT mice (means ± SD). (C) Purified T cells from p110γ−/− and p110γ+/− spleens were activated using anti-CD3 for different times, and the CD3- or Tyr kinase–associated protein fractions were immunoprecipitated. CD3- and Tyr kinase–associated PI3K lipid kinase activity was determined by ELISA. Means ± SD are shown for three different experiments. *, P ≤ 0.05; **, P ≤ 0.01.
Figure 3.
Figure 3.
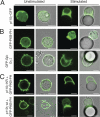
p110γ regulates PIP3 accumulation at the IS. Jurkat T cells were transfected with p110γ-GFP (A), GFP–PKB-PH (B, top), or GFP-Gβ1 plus Gγ2 (B, bottom), and with a combination of GFP–PKB-PH and either p110γ-KR (C, top) or p110γ-WT (C, bottom). GFP distribution was examined by confocal microscopy of live cells. (A) p110γ-GFP localized to the cell–cell contact site but did not concentrate at the IS. (B) GFP–PKB-PH is located at the cell membrane and redistributes to the IS after stimulation with anti-CD3– plus anti-CD28–coated latex beads (top). As a control, GFP-Gβ1 concentrated at the IS after stimulation (bottom). (C) The PIP3 probe GFP–PKB-PH concentrated at the IS in activated cells expressing p110γ WT (bottom) but not in cells expressing a dominant-negative p110γ form (p110γ-KR; top). For each experiment, we analyzed 100 cells. The p110γ-GFP image is representative of 80% of the cells. The GFP–PKB-PH concentration at the IS after stimulation was observed in 77% of the cells, whereas the GFP-Gβ1 image represents >95% of the cells. The p110γ-KR plus GFP–PKB-PH image represents 75% of the cells, and 82% of the cells for p110γ WT plus GFP–PKB-PH. Bars: 7.5 μm.
Figure 4.
Figure 4.
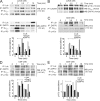
p110γ interacts with Lck and ZAP70, and is downstream of CD3. Jurkat T cells were transiently transfected with pEGFP-CXCR4. After 36 h, cells were collected and activated with anti-CD3 mAb for different times. Lysates were immunoprecipitated using anti-Lck, -ZAP70, -Gαq/11, or -p110γ mAb and blotted with anti-p110γ (A, top) and anti-ZAP70 (A, bottom) mAb. (B) Lysates were immunoprecipitated with anti-GFP (CXCR4) and blotted with anti-p110γ, Gαq/11, or ZAP70. (C) Purified T cells (CD3+), (D) purified CD4+ T cells, or (E) purified CD8+ T cells from WT mice were collected and activated with anti-CD3 mAb for different times. Lysates were immunoprecipitated using anti-Lck, -ZAP70, -Gαq/11, or -p110γ mAb and blotted with anti-p110γ mAb. The histograms represent the x-fold increase in the Western blot signal of p110γ associated to Lck, ZAP70, or Gαq/11 at different time points (t), quantitated using ImageJ and compared with that obtained at t = 0. Arrows indicate maximum complex formation.
Figure 5.
Figure 5.
Impaired signaling downstream of TCR in p110γ−/− mice. Purified peripheral T cells from p110γ−/− and p110γ+/− mice were stimulated by cross-linking with anti-CD3 or anti-CD3 plus anti-CD28 for the times indicated. T cell lysates were resolved in SDS-PAGE, followed by Western blot with (A) anti–phospho-Tyr (P-Tyr), (B) anti–phospho-PKB (P-PKB) and anti-PKB, and (C) anti–phospho-p44/42 MAPK (P-MAPK) and anti-p44/42 MAPK (MAPK) antibodies; anti-PKB and -MAPK antibodies were used as loading controls, as indicated. The figures show one representative blot of at least three experiments with similar results. Data from the Western blots were quantified by densitometry using ImageJ software and are reported as the x-fold intensity increase compared with t = 0. Dashed lines separate blots for different activation conditions. Histograms represent means ± SD of three (P-PKB and P-ERK) or four (P-Tyr) experiments with similar results (A, P ≤ 0.01; B, P ≤ 0.05; C, P ≤ 0.01). In the P-Tyr blot, numbers indicate molecular weight markers (MWM; left).
Figure 6.
Figure 6.
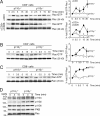
p110γ controls Rac activation downstream of the TCR. (A) Rac activity assay in purified p110γ−/− and p110γ+/− peripheral T cells. T cells were stimulated with soluble anti-CD3 antibody or anti-CD3 plus anti-CD28 antibody. Extracts were analyzed in pulldown assays using Gex2T-CRIBPak1 as bait. Rac-GTP and total Rac cell content were examined by Western blotting. One representative analysis is shown out of three performed. Data from Western blots were quantified by densitometry and are reported as the x-fold intensity of the GTP-Rac1 signal compared with that observed at t = 0. Data represent means ± SD of three experiments. (B) Rac activity assay in purified CD4+ p110γ−/− and p110γ+/− T cells as in A. (C) Rac activity assay in purified CD8+ p110γ−/− and p110γ+/− T cells as in A. (D) Representative immunoblots of class IA p110α, p110β, and p110δ subunits in purified p110γ−/− and p110γ+/− CD3+ peripheral T cells. PKB and Rac Western blots illustrate equal loading. Dashed lines separate blots for different mouse phenotypes. MWM, molecular weight markers.
Figure 7.
Figure 7.
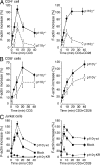
p110γ regulates TCR-induced actin polymerization. (A and B) CD4+ (A) or CD8+ (B) purified T cells from p110γ−/− and p110γ+/− mice were stimulated with soluble anti-CD3 or anti-CD3 plus anti-CD28 mAb for the times indicated. Phalloidin staining was determined by flow cytometry and is expressed as the increase in mean fluorescence intensity over that observed at t = 0. Means ± SD are shown for three independent experiments. (C) p110γ interferes with actin polymerization in Jurkat T cells. Jurkat T cells were transfected with vector alone, p110γ, or p110γ-KR (48 h) and activated with soluble anti-CD3 or anti-CD3 plus anti-CD28 mAb for the times indicated. Phalloidin staining was determined by flow cytometry and is expressed as in A. Means ± SD are shown for three independent experiments.
Figure 8.
Figure 8.
p110γ regulates cell conjugate formation. (A) p110γ−/− CD4+ T cells showed impaired TCR-induced conjugate formation. Purified CD4+ T cells were obtained from 5CC7 Tg × p110γ−/− and 5CC7 Tg × p110γ+/− spleens. For APCs, B cells were purified from 5CC7 Tg × p110γ+/− spleens. T cells were labeled with PKH67 (green) and APCs were labeled with PKH26 (red), and B cells were pulsed with PCC peptide88104. Conjugate formation, as determined by flow cytometry, is represented as the T cell fraction that shifted into two-color conjugates. Means ± SD are shown for three independent experiments. (B) TCR-induced conjugate formation was impaired in p110γ−/− CD8+ T cells. Purified CD8+ T cells were obtained from F5 Tg × p110γ−/− and F5 Tg × p110γ+/− spleens; B cells (APCs) were purified from F5 Tg × p110γ+/− spleens. Cells were labeled as in A, and B cells were pulsed with the influenza peptide NP366–374. Conjugate formation was determined as in A. (C) p110γ interferes with conjugate formation in Jurkat T cells. Jurkat cells were transfected with vector alone, p110γ, or p110γ-KR (48 h) and mixed with SEE-loaded Raji B cells for the times indicated. Conjugate formation was determined as in A.

References

    1. Fruman, D.A. 2004. Phosphoinositide 3-kinase and its targets in B-cell and T-cell signaling. Curr. Opin. Immunol. 16:314–320. - PubMed
    1. Okkenhaug, K., and B. Vanhaesebroeck. 2003. PI3K in lymphocyte development, differentiation and activation. Nat. Rev. Immunol. 3:317–330. - PubMed
    1. Stephens, L.R., A. Eguinoa, H. Erdjument-Bromage, M. Lui, F. Cooke, J. Coadwell, A.S. Smrcka, M. Thelen, K. Cadwallader, P. Tempst, and P.T. Hawkins. 1997. The G beta gamma sensitivity of a PI3K is dependent upon a tightly associated adaptor, p101. Cell. 89:105–114. - PubMed
    1. Lopez-Ilasaca, M., P. Crespo, P.G. Pellici, J.S. Gutkind, and R. Wetzker. 1997. Linkage of G protein-coupled receptors to the MAPK signaling pathway through PI 3-kinase gamma. Science. 275:394–397. - PubMed
    1. Stoyanov, B., S. Volinia, T. Hanck, I. Rubio, M. Loubtchenkov, D. Malek, S. Stoyanova, B. Vanhaesebroeck, R. Dhand, B. Nürnberg, et al. 1995. Cloning and characterization of a G protein-activated human phosphoinositide-3 kinase. Science. 269:690–693. - PubMed

Publication types

MeSH terms

Substances