. 2007 Dec;130(6):611-29.
doi: 10.1085/jgp.200709781. Epub 2007 Nov 12.

A segment of gamma ENaC mediates elastase activation of Na+ transport

Affiliations

A segment of gamma ENaC mediates elastase activation of Na+ transport

Adedotun Adebamiro et al. J Gen Physiol. 2007 Dec.

Abstract

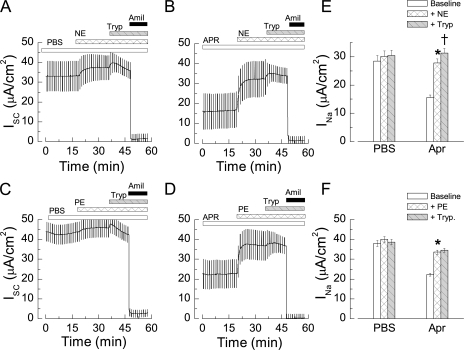
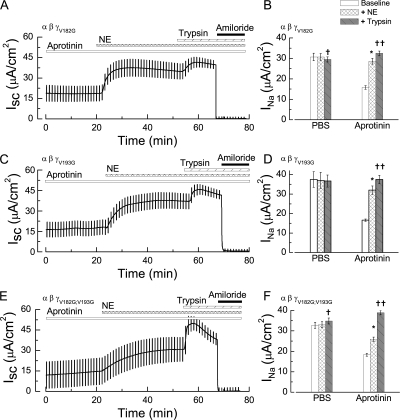
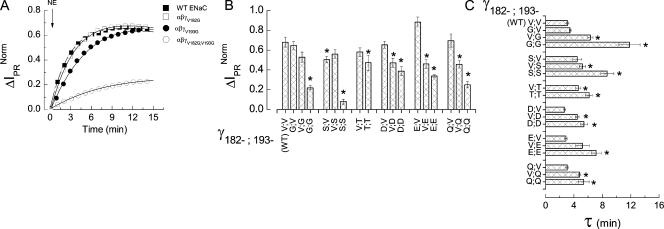
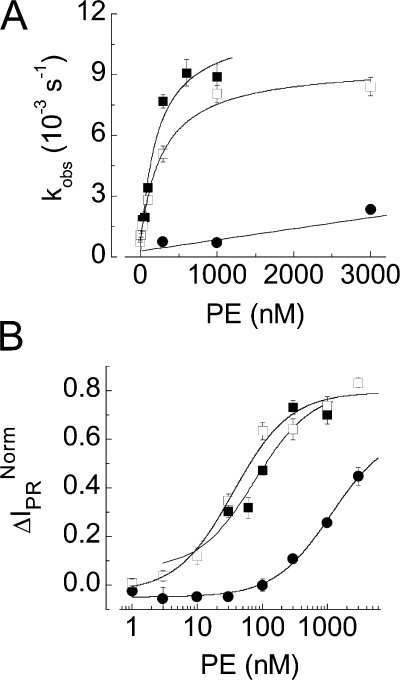
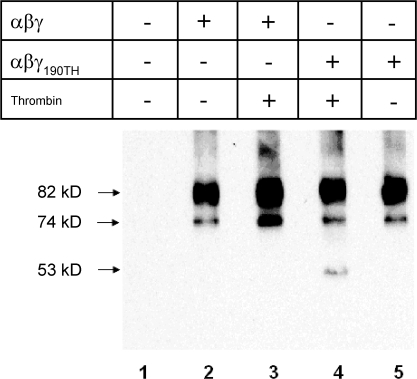
The epithelial Na(+) channel (ENaC) that mediates regulated Na(+) reabsorption by epithelial cells in the kidney and lungs can be activated by endogenous proteases such as channel activating protease 1 and exogenous proteases such as trypsin and neutrophil elastase (NE). The mechanism by which exogenous proteases activate the channel is unknown. To test the hypothesis that residues on ENaC mediate protease-dependent channel activation wild-type and mutant ENaC were stably expressed in the FRT epithelial cell line using a tripromoter human ENaC construct, and protease-induced short-circuit current activation was measured in aprotinin-treated cells. The amiloride-sensitive short circuit current (I(Na)) was stimulated by aldosterone (1.5-fold) and dexamethasone (8-fold). Dexamethasone-treated cells were used for all subsequent studies. The serum protease inhibitor aprotinin decreased baseline I(Na) by approximately 50% and I(Na) could be restored to baseline control values by the exogenous addition of trypsin, NE, and porcine pancreatic elastase (PE) but not by thrombin. All protease experiments were thus performed after exposure to aprotinin. Because NE recognition of substrates occurs with a preference for binding valines at the active site, several valines in the extracellular loops of alpha and gamma ENaC were sequentially substituted with glycines. This scan yielded two valine residues in gamma ENaC at positions 182 and 193 that resulted in inhibited responses to NE when simultaneously changed to other amino acids. The mutations resulted in decreased rates of activation and decreased activated steady-state current levels. There was an approximately 20-fold difference in activation efficiency of NE against wild-type ENaC compared to a mutant with glycine substitutions at positions 182 and 193. However, the mutants remain susceptible to activation by trypsin and the related elastase, PE. Alanine is the preferred P(1) position residue for PE and substitution of alanine 190 in the gamma subunit eliminated I(Na) activation by PE. Further, substitution with a novel thrombin consensus sequence (LVPRG) beginning at residue 186 in the gamma subunit (gamma(Th)) allowed for I(Na) activation by thrombin, whereas wild-type ENaC was unresponsive. MALDI-TOF mass spectrometric evaluation of proteolytic digests of a 23-mer peptide encompassing the identified residues (T(176)-S(198)) showed that hydrolysis occurred between residues V193 and M194 for NE and between A190 and S191 for PE. In vitro translation studies demonstrated thrombin cleaved the gamma(Th) but not the wild-type gamma subunit. These results demonstrate that gamma subunit valines 182 and 193 are critical for channel activation by NE, alanine 190 is critical for channel activation by PE, and that channel activation can be achieved by inserting a novel thrombin consensus sequence. These results support the conclusion that protease binding and perhaps cleavage of the gamma subunit results in ENaC activation.


Figures

Figure 1.
Figure 1.
Expression of ENaC and the corticosteroid effect on Na+ transport in FRT epithelial cells. FRT cells stably transfected with the tripromoter vector containing the α, β, and γ human ENaC subunits were short-circuited in Ussing chambers with symmetrical NaCl, NaHCO3 buffered ringers. (A) Representative current traces of unstimulated (Ctrl), aldosterone (30 nM), and dexamethasone (30 nM) stimulated cells. The vertical deflections are current responses to 4-mV bipolar pulses for monitoring transepithelial resistance. Amiloride (50 μM), was added to the apical side for the indicated period (bars) to determine INa, the amiloride-sensitive component of the ISC. (B) Summary of the amiloride-sensitive INa (mean ± SEM; n = 7–11).
Figure 2.
Figure 2.
Na+ transport regulation by aprotinin and trypsin in FRT epithelial cells. (A) Representative ISC traces in FRT cells expressing ENaC, preincubated with and kept in vehicle (PBS) control or aprotinin (APR; 10 μM) during short-circuiting as indicated by the bars. Also shown are traces from cells prestimulated with dexamethasone (30 nM). Trypsin (15 μM) and amiloride (50 μM) were added to the apical side as indicated (horizontal bars). (B) INa (mean ± SEM, n = 11–18) before (open bars) and after (solid bars) addition of trypsin in PBS-preincubated cells and aprotinin-preincubated cells without or with dexamethasone stimulation as indicated. *, P < 0.05 by paired Student's t test comparison of INa at baseline and after addition of trypsin (ITryp).
Figure 3.
Figure 3.
RT-PCR analysis of γ ENaC expression in parental and hENaC-FRT cells. RNA was isolated from parental or hENaC-FRT cells. PCR products were obtained with specific primers spanning identical nucleotide sequences in rat and human γENaC. PCR products were separated on a 0.9% agarose gel and visualized by ethidium bromide staining. Lane 1, standard DNA marker with 1-kb Plus DNA ladder; lanes 2 and 3, RT-PCR of RNA derived from parental cells; lanes 4 and 5, RT-PCR of RNA derived from hENaC FRT cells. Cells for lanes 3 and 5 were treated with 30 nM dexamethasone. The expected PCR product of 1569 bp was detected only in hENaC-FRT cells.
Figure 4.
Figure 4.
Elastase-mediated activation of ENaC in FRT cells. (A–D) Representative ISC in FRT cells expressing ENaC that were either pretreated with PBS (A and C) or with 10 μM aprotinin (B and D). (A and B) NE (300 nM) or (C and D) PE (300 nM) was added to the apical bath of short-circuited cells. Trypsin (15 μM) and amiloride (50 μM) were subsequently added to the apical baths in all experiments as indicated (horizontal bars). (E) INa (mean ± SEM, n = 16–24) before (open bars), after 300 nM of NE or (F) PE (stripped bars), and after 15 μM trypsin (shaded bars). *, P < 0.05 in paired Student's t tests of baseline INa and after NE or PE addition. †, P < 0.05 in paired student's t tests of INa after NE/PE and after trypsin.
Figure 5.
Figure 5.
Two point mutations in γ ENaC inhibit NE activation of INa in FRT cells. (A) Representative ISC of cells expressing γV182G, (C) γV193G, and (E) γV182G;193G that were pretreated with 10 μM aprotinin before short circuiting. NE (300 nM) was added to the apical bath as indicated (horizontal bars). Subsequently, trypsin (15 μM) and amiloride (50 μM) were added. (B, D, and F) Mean (±SEM, n = 13–39) of baseline INa (open bars), IPR (stripped bars), and ITryp (shaded bars) in cells pretreated with PBS or aprotinin that were expressing αβγV182G (B), αβγV193G (D), and αβγV182G;193G (F) mutants. *, P < 0.05 in Student's t test comparison of amiloride-sensitive ISC before and after NE. †, P < 0.05; ††, P < 0.01 in Student's t test comparison of amiloride sensitive ISC after NE and after trypsin.
Figure 6.
Figure 6.
Effect of mutating residues 182 and 193 in the extracellular domain of γ ENaC on NE activation of INa. NE (300 nM) was added to short-circuited FRT cells expressing the indicated γ ENaC mutants that were pretreated with 10 μM aprotinin. 30 min after addition of NE, trypsin (15 μM) was added in excess over aprotinin to achieve a reference point for maximal protease stimulation. (A) Representative traces of ΔIPR Norm for NE activation of wild type (solid squares), αβγV182G (open squares), αβγV193G (solid circles), and αβγV182G; 193G (open circles) ENaCs. The solid lines are the exponential fits of the data. (B) Steady-state values of ΔIPR Norm for the amino acid substitution at 182 and 193 in γ ENaC (mean ± SEM, n = 6–36). *, P < 0.05, one way ANOVA and t test comparison with wild type. (C) Summary of the τ from experiments described above (mean ± SEM, n = 4–10) for several amino acid substitutions at residues 182 and 193 in γ ENaC. *, P < 0.01, one way ANOVA.
Figure 7.
Figure 7.
Effect of mutations at 182, 190, and 193 in the extracellular domain of γ ENaC on PE activation of INa.. PE (300 nM) was added to short-circuited FRT cells expressing the indicated γ ENaC mutants that were pretreated with 10 μM aprotinin. 20 min after addition of PE, trypsin (15 μM) was added in excess over aprotinin to achieve a reference point for maximal protease stimulation. (A and B) Representative ISC trace of FRT cells expressing wild type or αβγV182G;V193G mutant. (C) Representative ΔIPR Norm response to PE for wild type (solid squares) and αβγV182G;V193G (open squares) mutant with exponential fits (solid lines). (D) Summary of the τ (±SEM, n = 4–11) from experiments described above for double substitutions at residues 182 and 193 in γ ENaC. (E) The steady-state ΔIPR Norm (±SEM, n = 8–23) ratios for the double substitutions at 182 and 193 in γ ENaC. (F and G) Representative ISC trace for FRT cells expressing wild type, αβγV182G;V193G, and αβγA190G ENaC, respectively. 1,000 nM PE was used. (H and I) τ (±SEM, n = 5–8) and steady-state ΔIPR Norm (±SEM, n = 5–8) for responses to 1,000 nM PE in cells expressing wild type (open bars), αβγV182G;193G (light gray bars), and αβγA190G (dark gray bars). *, P < 0.05, one way ANOVA and t test comparison with wild type.
Figure 8.
Figure 8.
NE concentration dependence of the activation of INa in FRT cells expressing wild type and αβγV182G;V193G mutant ENaC. (A) Representative ΔIPR Norm responses in FRT cells expressing wild-type ENaC to 30 nM NE (solid squares), 100 nM NE (open squares), 300 nM NE (solid circles), 600 nM NE (open circles), and 1,000 nM NE (solid triangles). (B) Representative ΔIPR Norm responses in FRT cells expressing αβγV182G;V193G to 30 nM NE (solid squares), 100 nM NE (open squares), 300 nM NE (solid circles), 600 nM NE (open circles), and 1,000 nM NE (solid triangles). (C) Mean (±SEM, n = 7–8) of kobs (=1/τ) with respect to the NE concentration for FRT cells expressing wild type (solid squares) and αβγV182G;V193G (open squares) ENaC. The solid line through the solid squares is the predicted values from a fit of the wild-type dataset to a kinetic model (see Results) were kcat = 14.2 10−3 s−1 and KM = 570 nM. The solid line through the open squares is a linear regression of the αβγV182G;V193G dataset with slope 1,300 M−1s−1 (P < 0.05). (D) Steady-state ΔIPR Norm (±SEM, n = 7–8) ratios for wild type (solid squares) and αβγV182G;193G mutant (open squares). Solid lines are fits of the datasets to saturation kinetics. K1/2 was 89 and 470 nM, respectively.
Figure 9.
Figure 9.
PE concentration dependence of the activation of INa in FRT cells expressing wild type, αβγV182G;V193G mutant, or αβγA190G ENaC. (A) Mean (±SEM, n = 8) of kobs with respect to the PE concentration for FRT cells expressing wild type (solid squares) and αβγV182G;V193G ENaC (open squares), and αβγA190G ENaC (solid circles). The solid lines are the kinetic fits of the data as described in Materials and methods; fitted parameters kcat and KM were 11.4 × 10⁻³ s−1 and 204 nM for wild-type ENaC; 8.7 × 10⁻³ s−1 and 294 nM for αβγV182G;V193G. Linear regression of the kobs versus PE concentration for αβγA190G gave a slope of 550 ± 89 M−1s−1 (P < 0.05). (D) ΔIPR Norm (mean ± SEM, n = 8) ratios for wild type (solid squares) and αβγV182G;V193G (open squares) mutant. Solid lines are fits to saturation kinetics. K1/2 was 77 ± 35, 35 ± 9.2, and 1140 ± 221 nM, respectively.
Figure 10.
Figure 10.
Thrombin-dependent activation of INa achieved by insertion of a thrombin recognition sequence. (A) Addition of NE, PE, and TH (300 nM) to FRT cells expressing wild-type ENaC or (B) FRT cells expressing αβγTh (γ186…iihka→γ186…lvprg) ENaC pretreated with aprotinin (10 μM) for the indicated period. Trypsin (15 μM) and amiloride (50 μM) were added as indicated. (C) INa (mean ± SEM, n = 8) in FRT cells expressing wild type and αβγV182G;V193G at baseline (open bars) and subsequent to 300 nM TH (hatch bars) and 15 μM Trypsin (stripped bars). *, P < 0.05, t test comparison of INa at baseline with INa after TH; †, P < 0.01, t test comparison of INa after TH with INa after trypsin. (D) Summary of the effect of NE (open bars), PE (gray bars), and TH (black bars) on wild type and αβγTh ENaC as measured by ΔIPR Norm (mean ± SEM, n = 8). *, P < 0.05, one way ANOVA and t test comparison with wild type. (E) The concentration dependence of kobs (mean ± SEM, n = 5) and (F) ΔIPR Norm (mean ± SEM, n = 5) for TH activation of current for αβγTh. Solid lines are fits to the data as described in Materials and methods. Parameters kcat and KM were 10.1 × 10⁻³ s−1 and 340 nM. The half maximal concentration for ΔIPR Norm was 15 nM.
Figure 11.
Figure 11.
Thrombin cleavage of the γTh subunit but not the wt-γ subunit. Wild type αβhENaC plus wt-γ or γTh hENaC cDNAs were transcribed and translated in vitro in the presence of microsomes. Microsomes were pelleted, lysed, and treated with buffer or 200 nM thrombin for 5 min. Samples were run on SDS-PAGE and probed by Western blot with an anti-V5 antibody targeting a V5 epitope on the C terminus on the γ subunit. Lane 1, negative control without ENaC cDNA; lanes 2 and 3, with wt αβγ hENaC cDNA; lanes 4 and 5 with αβγTh hENaC cDNA. Samples in lanes 3 and 4 were treated with 200 nM thrombin. In vitro translation of αβγ hENaC yielded two major bands at 82 and 74 kD. Thrombin treatment of the αβγTh hENaC produced a lower mass band at 53 kD as expected for cleavage of the γ subunit at R189. The 53-kD band was not observed in thrombin treated wt αβγ ENaC samples. These results are representative of three similar experiments.

References

    1. Adebamiro, A., Y. Cheng, J.P. Johnson, and R.J. Bridges. 2005. Endogenous protease activation of ENaC: effect of serine protease inhibition on ENaC single channel properties. J. Gen. Physiol. 126:339–352. - PMC - PubMed
    1. Alvarez de la Rosa, D., H. Li, and C.M. Canessa. 2002. Effects of aldosterone on biosynthesis, traffic, and functional expression of epithelial sodium channels in A6 cells. J. Gen. Physiol. 119:427–442. - PMC - PubMed
    1. Andreasen, D., G. Vuagniaux, N. Fowler-Jaeger, E. Hummler, and B.C. Rossier. 2006. Activation of epithelial sodium channels by mouse channel activating proteases (mCAP) expressed in Xenopus oocytes requires catalytic activity of mCAP3 and mCAP2 but not mCAP1. J. Am. Soc. Nephrol. 17:968–976. - PubMed
    1. Auerswald, E.A., D. Horlein, G. Reinhardt, W. Schroder, and E. Schnabel. 1988. Expression, isolation and characterization of recombinant [Arg15,Glu52]aprotinin. Biol. Chem. Hoppe Seyler. 369(Suppl.):27–35. - PubMed
    1. Baugh, R.J., and J. Travis. 1976. Human leukocyte granule elastase: rapid isolation and characterization. Biochemistry. 15:836–841. - PubMed

Publication types

MeSH terms