. 2007 Dec;81(6):1201-20.
doi: 10.1086/522089. Epub 2007 Oct 31.

Type 2 NF1 deletions are highly unusual by virtue of the absence of nonallelic homologous recombination hotspots and an apparent preference for female mitotic recombination

Affiliations

Type 2 NF1 deletions are highly unusual by virtue of the absence of nonallelic homologous recombination hotspots and an apparent preference for female mitotic recombination

Katharina Steinmann et al. Am J Hum Genet. 2007 Dec.

Abstract

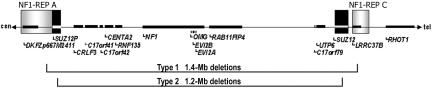
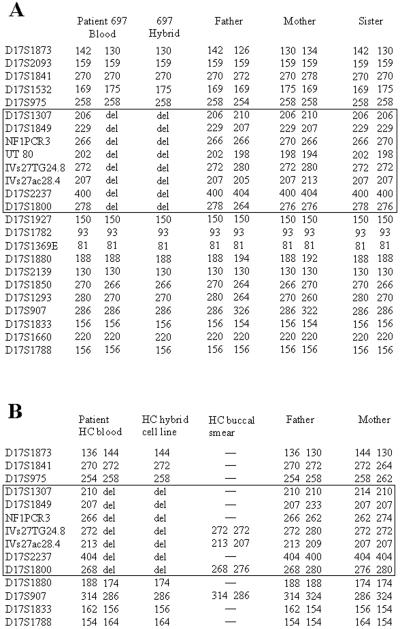
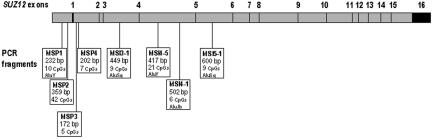
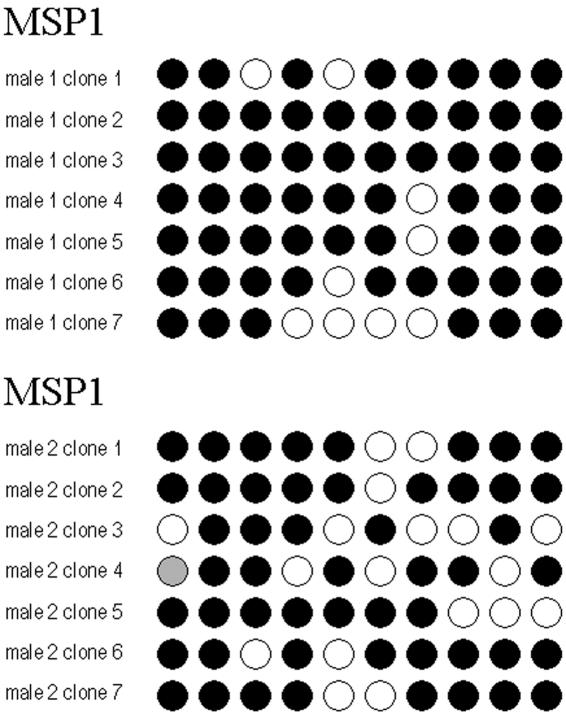
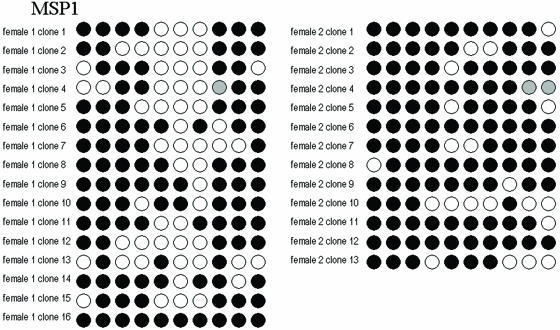
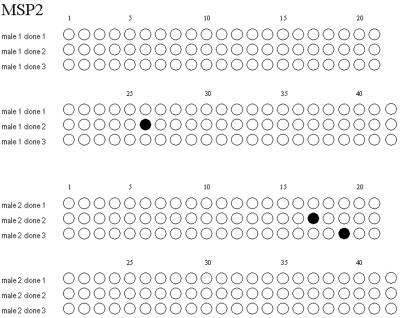
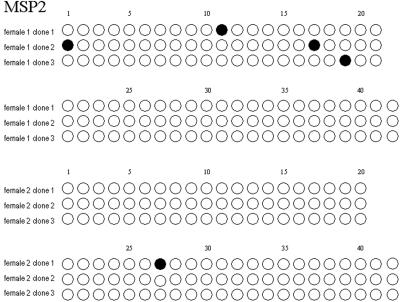
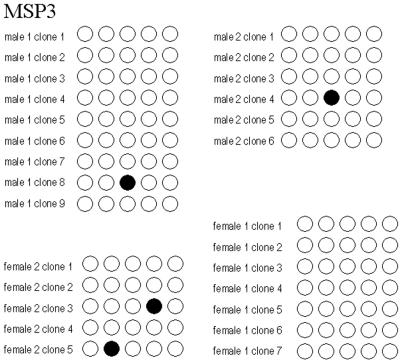
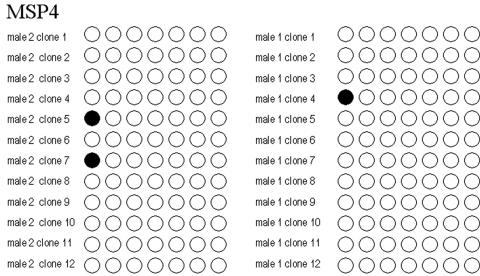
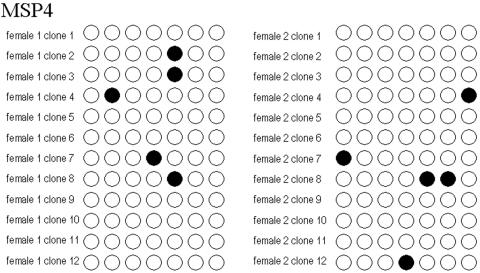
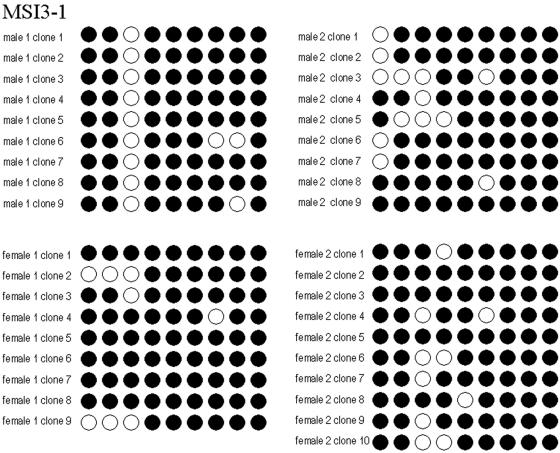
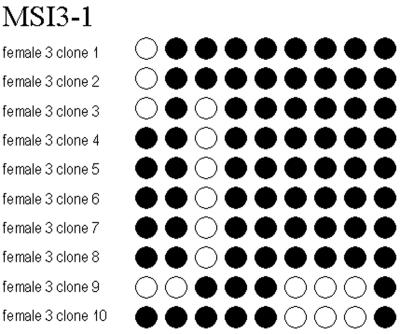
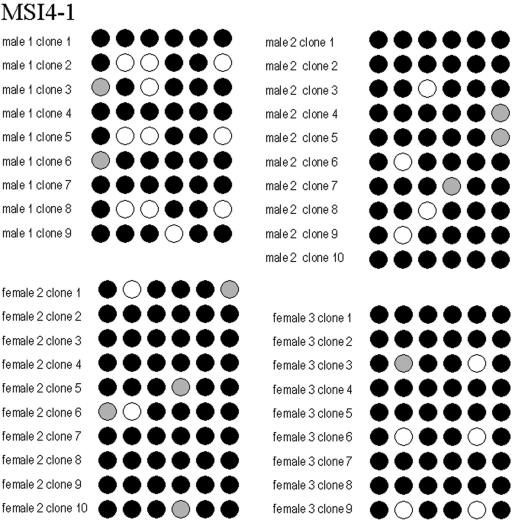
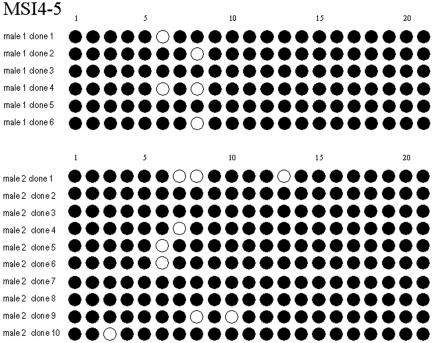
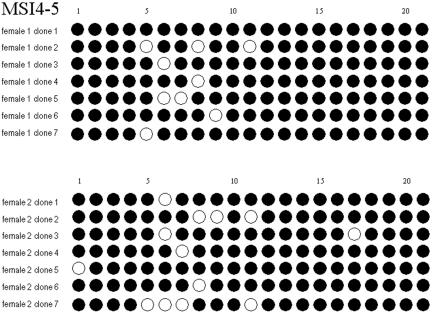
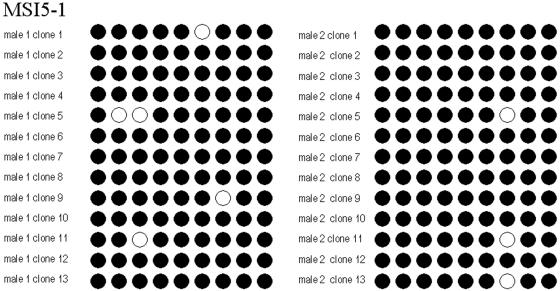
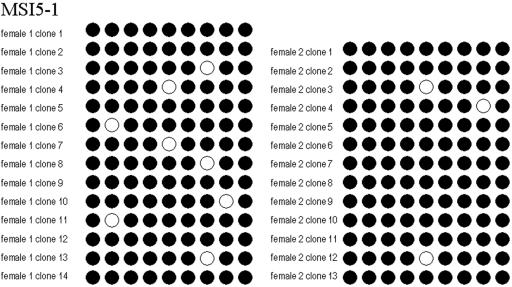
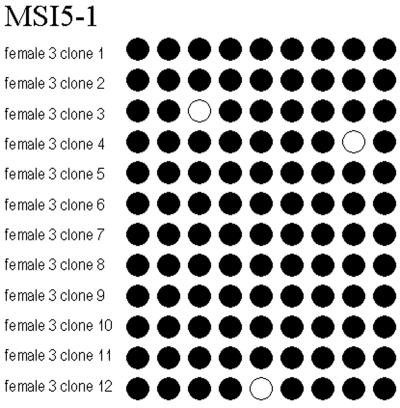
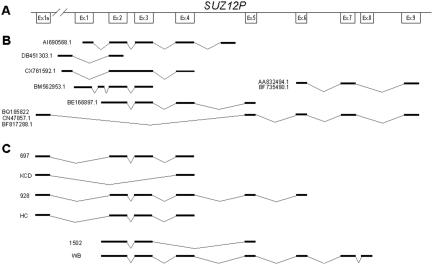
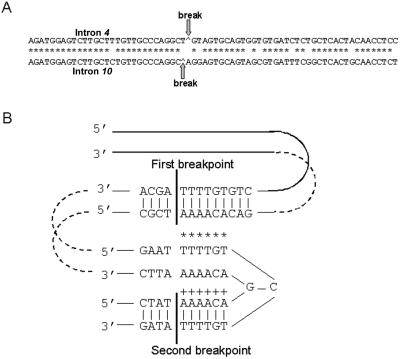
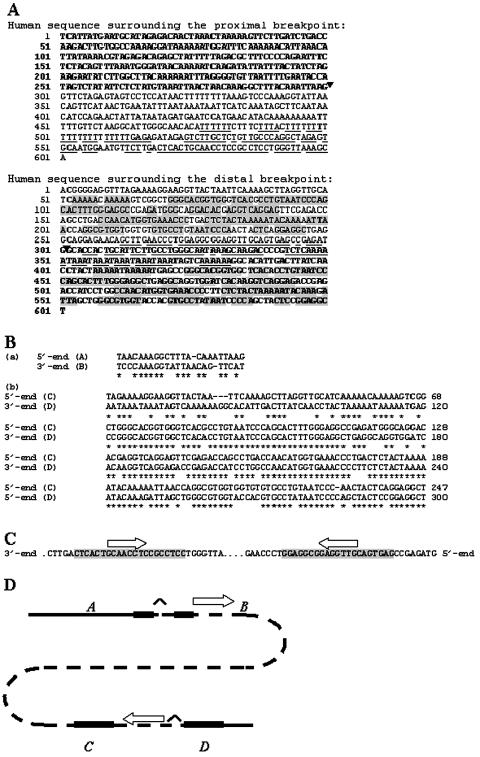
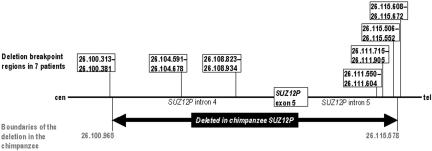
Approximately 5% of patients with neurofibromatosis type 1 (NF1) exhibit gross deletions that encompass the NF1 gene and its flanking regions. The breakpoints of the common 1.4-Mb (type 1) deletions are located within low-copy repeats (NF1-REPs) and cluster within a 3.4-kb hotspot of nonallelic homologous recombination (NAHR). Here, we present the first comprehensive breakpoint analysis of type 2 deletions, which are a second type of recurring NF1 gene deletion. Type 2 deletions span 1.2 Mb and are characterized by breakpoints located within the SUZ12 gene and its pseudogene, which closely flank the NF1-REPs. Breakpoint analysis of 13 independent type 2 deletions did not reveal any obvious hotspots of NAHR. However, an overrepresentation of polypyrimidine/polypurine tracts and triplex-forming sequences was noted in the breakpoint regions that could have facilitated NAHR. Intriguingly, all 13 type 2 deletions identified so far are characterized by somatic mosaicism, which indicates a positional preference for mitotic NAHR within the NF1 gene region. Indeed, whereas interchromosomal meiotic NAHR occurs between the NF1-REPs giving rise to type 1 deletions, NAHR during mitosis appears to occur intrachromosomally between the SUZ12 gene and its pseudogene, thereby generating type 2 deletions. Such a clear distinction between the preferred sites of mitotic versus meiotic NAHR is unprecedented in any other genomic disorder induced by the local genomic architecture. Additionally, 12 of the 13 mosaic type 2 deletions were found in females. The marked female preponderance among mosaic type 2 deletions contrasts with the equal sex distribution noted for type 1 and/or atypical NF1 deletions. Although an influence of chromatin structure was strongly suspected, no sex-specific differences in the methylation pattern exhibited by the SUZ12 gene were apparent that could explain the higher rate of mitotic recombination in females.


Figures

Figure  1.
Figure 1.
Map of the NF1 gene region indicating the relative sizes and breakpoint positions of type 1 and type 2 NF1 deletions. The gene loci are indicated as dark bars, and the positions of the NF1-REPs A and C are denoted by gray rectangles. The SUZ12 and SUZ12P regions are highlighted in black. cen = Centromere; tel = telomere.
Figure  2.
Figure 2.
Analysis of polymorphic chromosome 17 markers to determine the mechanism underlying the type 2 deletion of patient 697 (A) and to investigate the somatic mosaicism exhibited by patient HC (B). The rectangles highlight markers located within the region that is deleted on the maternal chromosome in patients 697 and HC.
Figure  3.
Figure 3.
Locations of the eight PCR fragments, MSP1–MSI5-1, within the SUZ12 gene. These fragments were analyzed to assess the methylation status of the SUZ12 gene/pseudogene sequences in males and females. Numbers in bold indicate the positions of the SUZ12 gene exons. In addition to the designation of the respective PCR fragments, their sizes (in bp) and the numbers of analyzed CpGs within each fragment are provided. Several fragment-spanning Alu repetitive sequences are also indicated.
Figure  4.
Figure 4.
Methylation pattern of fragments MSP1–MSI5-1, as determined in two male and two female control DNA samples. A blackened circle indicates methylated CpG; an unblackened circle indicates either unmethylated CpG or that we were unable to determine whether the fragment was methylated.
Figure  5.
Figure 5.
Alternative splice variants of the SUZ12 pseudogene. A, SUZ12P exons 1–9, assigned according to BLAST sequence alignments of the functional SUZ12 gene (GenBank accession number NM_015355 vs. accession number AC127024). Exon 1a is unique to the SUZ12P and has no homologue in the functional SUZ12 gene. In panel B, the GenBank accession numbers of the SUZ12P ESTs are indicated on the left of each splice variant. Horizontal bars indicate exons, whereas angled lines represent splicing. The EST with the GenBank accession number BQ185822 contains an upstream exon 1a encompassing the genomic region 26.060.815–26.060.955 of chromosome 17 (Ensembl 44, Human Genome Assembly 18 [hg18], National Center for Biotechnology Information [NCBI] build 36). C, RT-PCR products, detected in patients 697, KCD, 928, and HC, amplified with primers KSFP1f and KSFP1r, and RT-PCR products detected in patients 1502 and WB, amplified using primers KSFP2f and KSFP1r.
Figure  6.
Figure 6.
Sequence analysis of the deletion breakpoint regions in patients HC (A) and 928 (B). A, Complexity analysis revealed 57-bp stretches with 87% identity within the breakpoint regions of patient HC in intron 4 of the SUZ12 pseudogene (upper line) and intron 10 (lower line) of the SUZ12 gene. B, Hexanucleotide motif TTTTGT, found at the boundaries of the deletion in patient 928. This motif forms part of a symmetric element (TTTTGTCTGTTTT) that may have the propensity to form a non-B DNA triplex structure.
Figure  7.
Figure 7.
A, Extant human DNA sequence surrounding the breakpoints of the deletion detected in chimpanzee SUZ12P. The DNA sequence shown in bold letters is homologous to that still present in the chimpanzee genome flanking the evolutionary breakpoints, which are indicated by arrowheads. The human DNA sequence in plain font has been deleted from the chimpanzee genome. With the assumption that the human sequence is similar to the ancestral sequence, the deletion in the chimpanzee lineage could have been facilitated by direct repeats (gray) or inverted repeats (underlined). B, Homology evident between the regions flanking the proximal (a) and the distal (b) breakpoints in the human sequence. The uppercase letters assigned to the DNA ends are given in parentheses. C, Inverted repeats that could have mediated the deletion. D, Schematic representation of the structural elements that could have mediated the deletion. Sequences flanking the proximal and distal breakpoints are designated (1) A and B and (2) C and D, respectively. Breakpoint junctions are marked by a caret (∧). Homologous regions depicted in panel B are denoted by horizontal bars. Inverted repeats depicted in panel C and their orientations are indicated by horizontal arrows. The DNA sequence deleted as a result of the resolution of the secondary structure by excision is illustrated by broken lines.
Figure  8.
Figure 8.
Scheme of the region encompassing portions of introns 4 and 5 and exon 5 of SUZ12P that is deleted from the chimpanzee genome (black arrow). The numbers indicate nucleotide positions on human chromosome 17, according to the hg18, NCBI build 36. Numbers in gray refer to the boundaries of the deletion in chimpanzee. Numbers in black indicate the recombination regions identified in seven patients with type 2 deletions.

Similar articles

Cited by

References

Web Resources

    1. Ensembl, http://www.ensembl.org/index.html (for SUZ12 transcript [accession number ENSG00000178691] and the PanTro 2.1 chimpanzee genome assembly)
    1. GenBank, http://www.ncbi.nlm.nih.gov/Genbank/ (for SUZ12 [accession number NM_015355], SUZ12P [accession number BC047718], cDNA genomic sequence [accession number AC090616.12], BAC CTD-2349P21 [accession number AC127024], Homo sapiens cDNA clone ESTs [accession numbers BQ185822, AI690568.1, DB451303.1, CX761592.1, BM562953.1, BE166897.1, CN47857.1, and BF817288.1], and BAC RP11-142O6 [accession number AC079915])
    1. HapMap, http://www.hapmap.org/
    1. Online Mendelian Inheritance in Man (OMIM), http://www.ncbi.nlm.nih.gov/Omim/ (for NF1) - PubMed
    1. Perlegen, http://genome.perlegen.com/

References

    1. Cnossen MH, van der Est MN, Breuning MH, van Asperen CJ, Breslau-Siderius EJ, van der Ploeg AT, de Goede-Bolder A, van den Ouweland AM, Halley DJ, Niermeijer MF (1997) Deletions spanning the neurofibromatosis type 1 gene: implications for genotype-phenotype correlations in neurofibromatosis type 1? Hum Mutat 9:458–46410.1002/(SICI)1098-1004(1997)9:5<458::AID-HUMU13>3.0.CO;2-1 - DOI - PubMed
    1. Rasmussen SA, Colman SD, Ho VT, Abernathy CR, Arn PH, Weiss L, Schwartz C, Saul RA, Wallace MR (1998) Constitutional and mosaic large NF1 gene deletions in neurofibromatosis type 1. J Med Genet 35:468–471 - PMC - PubMed
    1. Kluwe L, Siebert R, Gesk S, Friedrich RE, Tinschert S, Kehrer-Sawatzki H, Mautner V-F (2004) Screening of 500 unselected neurofibromatosis 1 patients for deletions of the NF1 gene. Hum Mutat 23:111–11610.1002/humu.10299 - DOI - PubMed
    1. Dorschner MO, Sybert VP, Weaver M, Pletcher BA, Stephens K (2000) NF1 microdeletion breakpoints are clustered at flanking repetitive sequences. Hum Mol Genet 9:35–4610.1093/hmg/9.1.35 - DOI - PubMed
    1. Jenne DE, Tinschert S, Reimann H, Lasinger W, Thiel G, Hameister H, Kehrer-Sawatzki H (2001) Molecular characterization and gene content of breakpoint boundaries in patients with neurofibromatosis type 1 with 17q11.2 microdeletions. Am J Hum Genet 69:516–527 - PMC - PubMed

Publication types