. 2007 Dec;81(6):1304-15.
doi: 10.1086/524110. Epub 2007 Nov 1.

DNA methylation signatures within the human brain

Affiliations

DNA methylation signatures within the human brain

Christine Ladd-Acosta et al. Am J Hum Genet. 2007 Dec.

Abstract

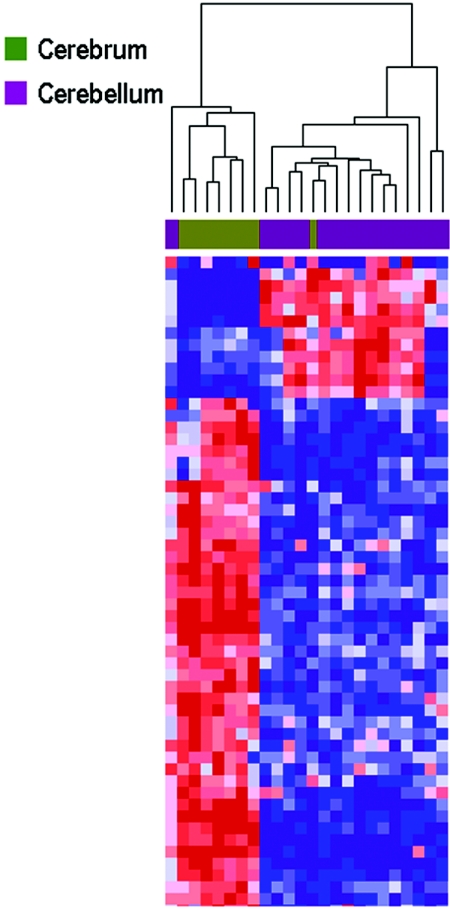
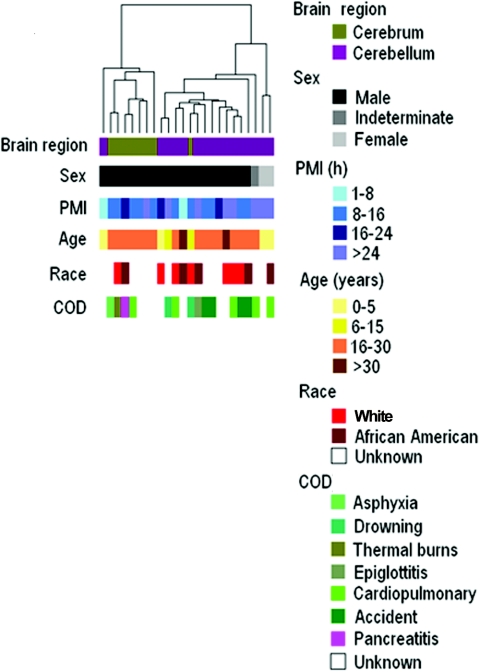
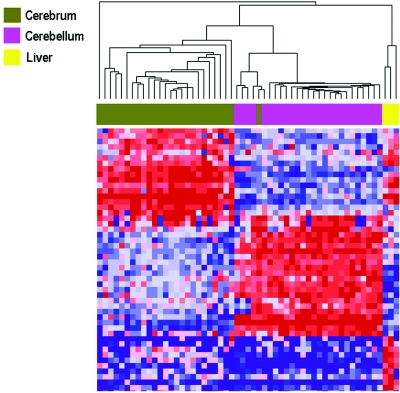
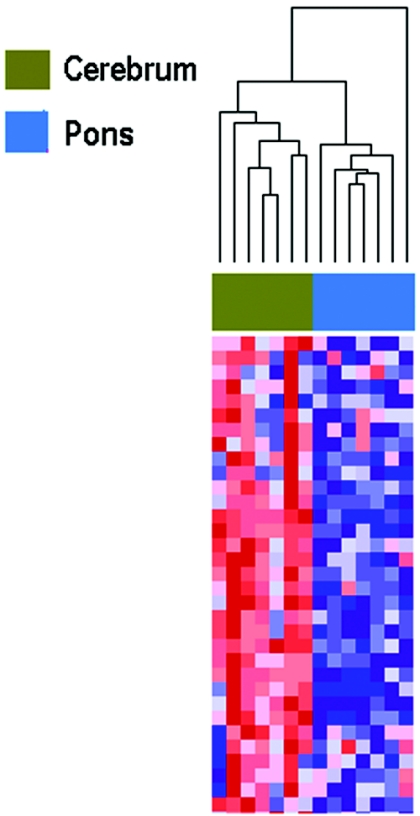
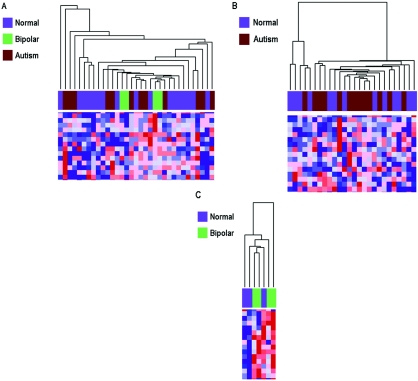
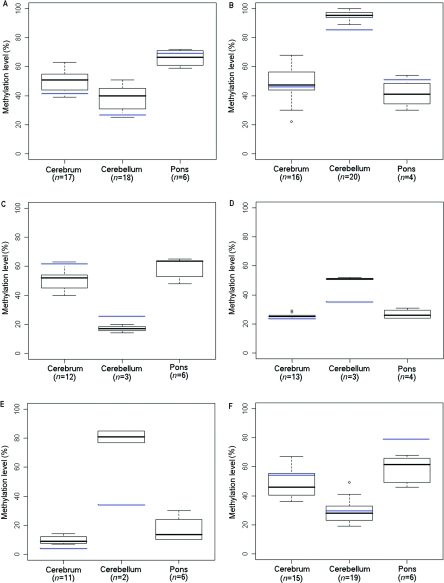
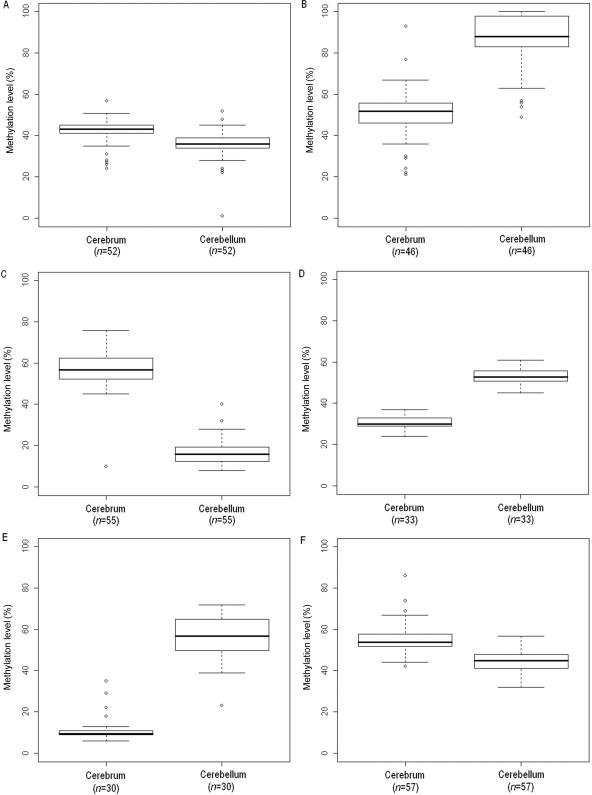
DNA methylation is a heritable modification of genomic DNA central to development, imprinting, transcriptional regulation, chromatin structure, and overall genomic stability. Aberrant DNA methylation of individual genes is a hallmark of cancer and has been shown to play an important role in neurological disorders such as Rett syndrome. Here, we asked whether normal DNA methylation might distinguish individual brain regions. We determined the quantitative DNA methylation levels of 1,505 CpG sites representing 807 genes with diverse functions, including proliferation and differentiation, previously shown to be implicated in human cancer. We initially analyzed 76 brain samples representing cerebral cortex (n=35), cerebellum (n=34), and pons (n=7), along with liver samples (n=3) from 43 individuals. Unsupervised hierarchical analysis showed clustering of 33 of 35 cerebra distinct from the clustering of 33 of 34 cerebella, 7 of 7 pons, and all 3 livers. By use of comparative marker selection and permutation testing, 156 loci representing 118 genes showed statistically significant differences--a >or=17% absolute change in DNA methylation (P<.004)--among brain regions. These results were validated for all six genes tested in a replicate set of 57 samples. Our data suggest that DNA methylation signatures distinguish brain regions and may help account for region-specific functional specialization.


Figures

Figure  1.
Figure 1.
Hierarchical clustering of methylation data from cerebral cortex and cerebellum samples analyzed in experiment 1. Methylation profiles of 1,532 CpG sites from 24 brain samples (16 cerebella and 8 cerebra) from 24 individuals were clustered using uncentered correlation and pairwise average linkage. Columns represent samples; rows correspond to CpG sites. Two major branches are defined by our methylation data and correlate with brain region, one containing 7 of 8 cerebra and one containing 15 of 16 cerebella. A heat map showing relative methylation differences (red indicates more methylated; blue indicates less methylated) from a handful of analyzed loci is represented in the clustering dendrogram.
Figure  2.
Figure 2.
Hierarchical clustering of methylation data from cerebral cortex and cerebellum samples analyzed in experiment 1. Methylation profiles of 1,532 CpG sites from 24 brain samples (16 cerebella and 8 cerebra) from different individuals were clustered using uncentered correlation and pairwise average linkage. Columns represent samples; rows are color bars that correspond to sample characteristics. As shown by the color bars, the two major dendrogram branches defined by our methylation data correlate most strongly with brain region, as opposed to age, sex, postmortem interval (PMI), cause of death (COD), or race.
Figure  3.
Figure 3.
Hierarchical clustering of methylation data from cerebral cortex, cerebellum, and liver samples analyzed in experiment 2. Methylation profiles of 1,505 CpG sites from 55 samples (26 cerebra, 26 cerebella, and 3 livers) from the same individuals were clustered using uncentered correlation and pairwise average linkage. Columns represent samples; rows correspond to CpG sites. Clustering of 26 of 26 cerebella, 25 of 26 cerebra, and all 3 livers is shown by the dendrogram. A heat map showing relative methylation differences (red indicates more methylated; blue indicates less methylated) from a handful of loci analyzed is represented below the clustering dendrogram. The heat map shows genes with greatest difference between the groups (complete list in table 4).
Figure  4.
Figure 4.
Hierarchical clustering of methylation data from cerebral cortex and pons samples analyzed in experiment 3. Methylation profiles of 1,505 CpG sites from 14 brain samples (7 cerebra and 7 pons) from the same individual were clustered using uncentered correlation and pairwise average linkage. Columns represent samples; rows correspond to CpG sites. Two major branches are defined by our methylation data and correlate with brain region: one containing seven of seven cerebra and one containing seven of seven pons. A heat map showing relative methylation differences (red indicates more methylated; blue indicates less methylated) from a handful of loci analyzed is represented below the clustering dendrogram.
Figure  5.
Figure 5.
Hierarchical clustering of methylation data from cerebral cortex, cerebellum, and pons samples analyzed in experiments 2 and 3. Columns represent samples, rows correspond to CpG sites, and heat maps showing relative methylation differences (red indicates more methylated; blue indicates less methylated) from a handful of loci analyzed are represented below the clustering dendrograms. All clustering analyses were performed using uncentered correlation and pairwise average linkage. A, Methylation profiles of 1,505 CpG sites from 33 cerebra samples (16 from normal individuals, 13 from individuals given diagnoses of autism, and 4 from individuals with bipolar disorder) were clustered. Clustering does not reveal disease-specific branches. B, Methylation profiles of 1,505 CpG sites from 26 cerebella samples (13 from normal individuals and 13 from individuals given diagnoses of autism) were clustered. Clustering does not reveal an autism-specific branch. C, Methylation profiles of 1,505 CpG sites from seven pons samples (three from normal individuals and four from individuals with bipolar disorder) were clustered. Clustering does not reveal a bipolar-specific branch.
Figure  6.
Figure 6.
Box plots of methylation data from bisulfite-pyrosequencing analysis. A, RASSF1. B, HDAC7A. C, HTR2A. D, GABRB3. E, EN2. F, MT1A. Mean methylation levels across all Illumina experiments are denoted by blue lines. n is the number of samples analyzed by pyrosequencing.
Figure  7.
Figure 7.
Box plots of methylation data from bisulfite-pyrosequencing analysis. A, RASSF1. B, HDAC7A. C, HTR2A. D, GABRB3. E, EN2. F, MT1A. n is the number of samples analyzed by pyrosequencing.

References

Web Resource

    1. Online Mendelian Inheritance in Man (OMIM), http://www.ncbi.nlm.nih.gov/Omim/ (for Rett syndrome, EN2, autism, HDAC7A, HTR2A, SLC22A3, IGF1, FGF1, FGFR2, and MAFD1)

References

    1. Feinberg AP (2007) Phenotypic plasticity and the epigenetics of human disease. Nature 447:433–44010.1038/nature05919 - DOI - PubMed
    1. Razin A, Riggs AD (1980) DNA methylation and gene function. Science 210:604–61010.1126/science.6254144 - DOI - PubMed
    1. Feinberg AP, Tycko B (2004) The history of cancer epigenetics. Nat Rev Cancer 4:143–15310.1038/nrc1279 - DOI - PubMed
    1. Amir RE, Van den Veyver IB, Wan M, Tran CQ, Francke U, Zoghbi HY (1999) Rett syndrome is caused by mutations in X-linked MECP2, encoding methyl-CpG-binding protein 2. Nat Genet 23:185–18810.1038/13810 - DOI - PubMed
    1. Callinan PA, Feinberg AP (2006) The emerging science of epigenomics. Hum Mol Genet 15:R95–R10110.1093/hmg/ddl095 - DOI - PubMed

Publication types