. 2007 Nov;136(4):623-38.
doi: 10.1037/0096-3445.136.4.623.

Low target prevalence is a stubborn source of errors in visual search tasks

Affiliations

Low target prevalence is a stubborn source of errors in visual search tasks

Jeremy M Wolfe et al. J Exp Psychol Gen. 2007 Nov.

Abstract

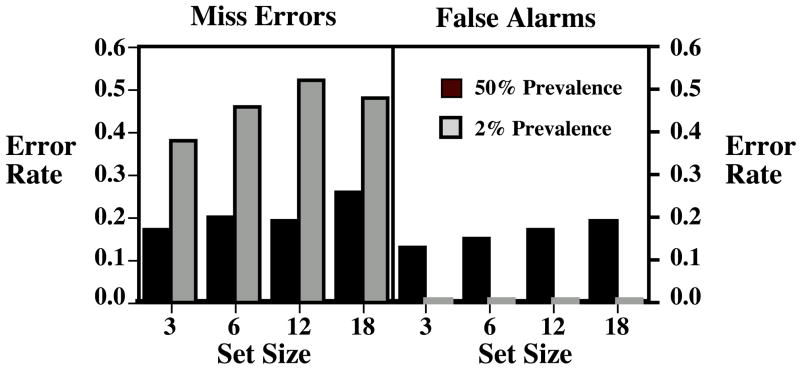
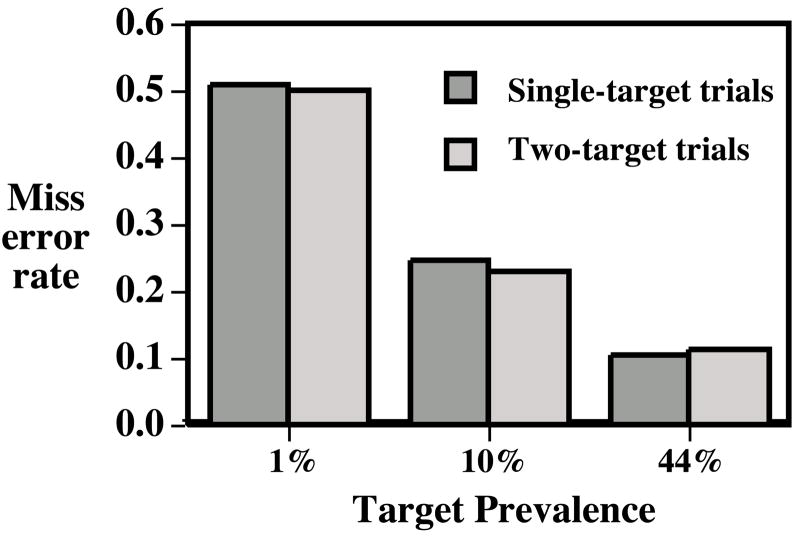
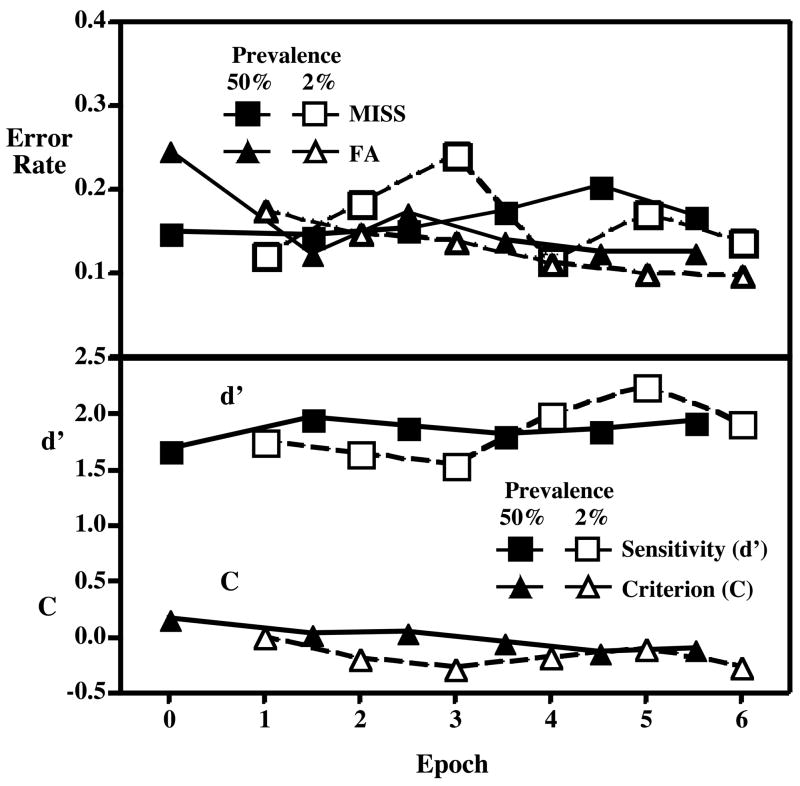
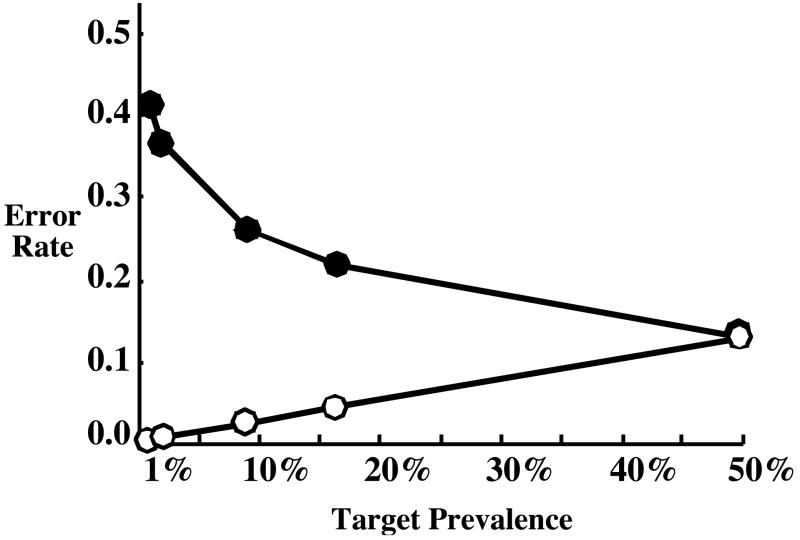
In visual search tasks, observers look for targets in displays containing distractors. Likelihood that targets will be missed varies with target prevalence, the frequency with which targets are presented across trials. Miss error rates are much higher at low target prevalence (1%-2%) than at high prevalence (50%). Unfortunately, low prevalence is characteristic of important search tasks such as airport security and medical screening where miss errors are dangerous. A series of experiments show this prevalence effect is very robust. In signal detection terms, the prevalence effect can be explained as a criterion shift and not a change in sensitivity. Several efforts to induce observers to adopt a better criterion fail. However, a regime of brief retraining periods with high prevalence and full feedback allows observers to hold a good criterion during periods of low prevalence with no feedback.


Figures

Figure 1
Figure 1
Sample of stimuli used in Experiment 1. This is a target-absent trial.
Figure 2
Figure 2
Miss and false alarm errors averaged over the 24 observers in Experiment 1. Notice that miss errors are elevated at low prevalence while false alarms are elevated at high prevalence. Note that within-subjects confidence intervals are not visible at this scale (about 1% for miss errors and less than that for false alarms).
Figure 3
Figure 3
Reaction time as a function of set size for 50% and 2% prevalence. Error bars are within-subjects confidence intervals based on the comparison between high and low prevalence for each trial type.
Figure 4
Figure 4
Paired errors – those targets missed by both observers – are greater than predicted by the product of the error rates of the individual observers.
Figure 5
Figure 5
Panel a shows miss errors at 2% prevalence as a function of time (binned into 250 trial quartiles). Dashed line represents miss rate at 50% prevalence. Panel b shows the corresponding d′ and criterion values.
Figure 6
Figure 6
Error rates for 2% and 50% prevalence. Solid bars are for Experiment 1b. Patterned bars are equivalent data from individual Os in Experiment 1a.
Figure 7
Figure 7
RT as a function of set size. Thick lines show data from Experiment 2. Thin lines reproduce data from Experiment 1a. Note that low prevalence RTs were markedly slowed by the “speeding tickets” handed out at low prevalence. Error bars are +/−1 s.e.
Figure 8
Figure 8
Error rates for trials without “speeding tickets” in Experiment 2. Note the similarity to Experiment la (Figure 2). Error bars are within-subject confidence intervals (not visible for false alarms).
Figure 9
Figure 9
Sample stimulus from Experiment 3. The target would be the drill at the bottom of the figure.
Figure 10
Figure 10
Miss error rates as a function of condition and target prevalence in Experiment 4. Dark bars show set size 3 data. Light bars show set size 18. Error bars are standard errors of the mean.
Figure 11
Figure 11
Miss error rates as a function of the number of targets and the number of targets in a display. Error rates are back-transformed from arcsine-transformed errors. Within-subject CI error bars are not visible at this scale.
Figure 12
Figure 12
Target prevalence (averaged over the preceding 20 trials) as a function of trial number for a typical observer in Experiment 6. Open symbols indicate miss errors. Filled ovals are hits.
Figure 13
Figure 13
Miss error rates as a function of set size for low (1%) prevalence and higher prevalence periods in Experiment 6. Error rates are back-transformed from arcsine-transformed errors. Error bars represent within-subject CIs.
Figure 14
Figure 14
RT for correct rejections (solid symbols) and miss error rate (open symbols) as a function of target prevalence (computed over 20 trial bins) in Experiment 6. Error bars are +/− 1 s.e.m.
Figure 15
Figure 15
Results for Experiment 7. Top panel shows miss and false alarm rates as a function of time. Epoch 0 is the initial practice block. Each subsequent epoch consists of 200 low prevalence trials (open symbols) followed by 40 high prevalence trials (filled symbols). Note that there were no significant effects of prevalence in this case. Bottom panel shows that d′ and C are similar for low and high prevalence trials. See text for discussion of error bars.
Figure 16
Figure 16
Average miss and false alarm rates for Experiments 1a and 7. Error bars are +/−1 s.e.m. of the difference.
Figure 17
Figure 17
Criterion and prevalence: If observers try to equate the number (not the proportions) of miss and false alarm errors, they will set a more liberal criterion at low prevalence (right side) than at high prevalence (left).
Figure 18
Figure 18
Z-transformed average data from Experiments 1a-individual (open circle), 1a-paired (gray filled circle), 1b-shared (gray squares), & 2a (black circles).
Figure 19
Figure 19
Results of a simulation of the effects of target prevalence on errors, based on the three assumptions outlined in the text. Open circles represent false alarms. Closed circles represent miss errors.

Similar articles

Cited by

References

    1. Baldassi S, Verghese P. Comparing integration rules in visual search. Journal of Vision. 2002;2(8):559–570. - PubMed
    1. Beck LH, Bransome ED, Jr, Mirsky AF, Rosvold HE, Sarason I. A continuous performance test of brain damage. Journal of Consulting Psychology. 1956;20(5):343–350. - PubMed
    1. Berbaum KS, Franken EA, Jr, Dorfman DD, Caldwell RT, Krupinski EA. Role of faulty decision making in the satisfaction of search effect in chest radiography. Academic Radiology. 2000;7(12):1098–1106. - PubMed
    1. Berbaum KS, Franken EA, Jr, Dorfman DD, Rooholamini SA, Kathol MH, Barloon TJ, et al. Satisfaction of search in diagnostic radiology. Investigative Radiology. 1990;25(2):133–140. - PubMed
    1. Bond AB, Kamil AC. Visual predators select for crypticity and polymorphism in virtual prey. Nature. 2002;415(6872):609–613. - PubMed

Publication types