. 2007;8(11):R241.
doi: 10.1186/gb-2007-8-11-r241.

Spore germination in Saccharomyces cerevisiae: global gene expression patterns and cell cycle landmarks

Affiliations

Spore germination in Saccharomyces cerevisiae: global gene expression patterns and cell cycle landmarks

Daphna Joseph-Strauss et al. Genome Biol. 2007.

Abstract

Background: Spore germination in the yeast Saccharomyces cerevisiae is a process in which non-dividing haploid spores re-enter the mitotic cell cycle and resume vegetative growth. To study the signals and pathways underlying spore germination we examined the global changes in gene expression and followed cell-cycle and germination markers during this process.

Results: We find that the germination process can be divided into two distinct stages. During the first stage, the induced spores respond only to glucose. The transcription program during this stage recapitulates the general transcription response of yeast cells to glucose. Only during the second phase are the cells able to sense and respond to other nutritional components in the environment. Components of the mitotic machinery are involved in spore germination but in a distinct pattern. In contrast to the mitotic cell cycle, growth-related events during germination are not coordinated with nuclear events and are separately regulated. Thus, genes that are co-induced during G1/S of the mitotic cell cycle, the dynamics of the septin Cdc10 and the kinetics of accumulation of the cyclin Clb2 all exhibit distinct patterns of regulation during spore germination, which allow the separation of cell growth from nuclear events.

Conclusion: Taken together, genome-wide expression profiling enables us to follow the progression of spore germination, thus dividing this process into two major stages, and to identify germination-specific regulation of components of the mitotic cell cycle machinery.


Figures

Figure 1
Figure 1
Spore germination in Saccharomyces cerevisiae SK1 strain. (a) Schematic representation of events known to occur during spore germination in S. cerevisiae. See the text for details. (b) Budding index and heat shock resistance of germinating spores. Purified SK1 spores were prepared from a diploid strain (DS1) and suspended in YPD medium at 30°C. Samples were taken at the indicated times. Budding index (blue line) was determined by counting 100 cells under the microscope at each time point, using a hemacytometer. For heat shock analysis (red line) aliquots of this germination reaction were removed, diluted and incubated at 55°C for 12 minutes and then plated on solid rich growth medium to determine the number of colony-forming survivors. The percentage of survivors relative to the number of colony forming cells before the heat shock is plotted. (c,d) Flow cytometry analysis of germinating spores. Purified spores were prepared from a diploid strain (DS1) and suspended in YPD medium at 30°C. Samples were taken at the indicated times for FACS analysis. Haploid cells were grown in YPD medium to log phase and a sample was taken for FACS analysis. (c) Percentage of G1 cells from all cells is plotted. The red line represents the percentage of G1 cells in log phase haploids. (d) FACS profiles of germinating spores and log phase haploids.
Figure 2
Figure 2
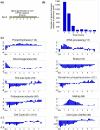
Description of the general transcription response of spores to YPD medium. (a) The experimental design. Mature spores (prepared from strain DS1) were incubated in rich medium (YPD) to induce spore germination. Each circle represents a time point at which genome-wide gene expression was monitored; RNA was extracted, labeled and hybridized to a micorarray complementary to all (approximately 6,200) yeast ORFs. The reference RNA was a mixture of RNA from Mata and Matα log phase cells. (b) Rapid and intensive changes in gene expression - number of genes whose expression changed at least two-fold compared to the previous time point. To reduce noise, gene expression at each time point was the averaged expression in time points covering one hour, compared to a similar average during the previous hour, except for the first time point, which was compared to gene expression in spores. (c) Average expression of genes in specific modules [16] during spore germination. In parentheses is the number of genes in the module. Shown are log2 values of expression relative to expression in vegetative cells. See Additional data file 1 for a complete list of genes that are included in the different modules.
Figure 3
Figure 3
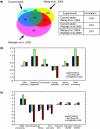
Common and unique aspects in the transcription response of spores to glucose. (a) Venn diagram comparing the genes induced during the first hour of spore germination, exit from stationary phase [10] or upon addition of glucose to vegetative cells starved of glucose [19]. A gene was defined as 'induced' if its average expression level during the first hour of the experiment was induced by at least two-fold relative to that before the addition of glucose or glucose-rich media. The area in the Venn diagram is proportional to the number of genes [46]. The correlations between changes in gene expression of all approximately 6,000 genes are indicated for pairs of experiments. Change in gene expression is the average change in expression during the first hour of the experiment relative to gene expression before the addition of glucose or glucose-rich media. (b,c) The average expression ratio during the same experiments as in (a) of genes that are related to specific GO terms (b) or in specific modules [16] (c).
Figure 4
Figure 4
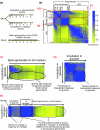
The transcription response of spores to different components of the medium. (a) The experimental design. Mature spores (prepared from strain DS1) were incubated in rich medium (YPD) that induces spore germination (Figure 2a) or in either component of the medium (glucose alone or 'nitrogen' - synthetic minimal medium without glucose). Each circle represents a time point at which genome-wide gene expression was monitored; RNA was extracted, labeled and hybridized to micorarray complementary to all (approximately 6,200) yeast ORFs. The reference RNA was a mixture of RNA from Mata and Matα log phase cells. (b) The matrix of pairwise correlations describing the similarity between gene expression of all approximately 6,200 genes in the yeast genome for each pair of time points following incubation of spores in glucose, 'nitrogen' or YPD media. Every point represents the correlation between the transcription patterns of two time points. *Correlations are color-coded according to the bar shown. (c-e) Enlargements of the parts marked in circles in the correlation matrix presented in (b).
Figure 5
Figure 5
Heat shock resistance of spores incubated with different nutrients. Heat shock analysis was done as described in Figure 1.
Figure 6
Figure 6
The transcription response of spores to different components of the medium. The average change in expression pattern (relative to spores) of genes in specific modules [16] during spore germination or during spores' incubation in glucose or 'nitrogen'. Expression patterns are shown as log2 ratios, and are color-coded for the log2 fold change according to the bar shown.
Figure 7
Figure 7
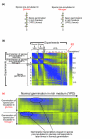
The transcription response to YPD medium of spores pre-incubated in different components of the medium. (a) The experimental design. Mature spores (prepared from strain DS1) were incubated in either component of the medium (glucose or 'nitrogen') for two hours and were then transferred to rich medium (YPD) to allow spore germination. Each circle represents a time point at which genome-wide gene expression was monitored; RNA was extracted, labeled and hybridized to micorarray complementary to all (approximately 6,200) yeast ORFs. The reference RNA was a mixture of RNA from Mata and Matα log phase cells. (b) The matrix of pairwise correlations (see legend for Figure 4) describing the similarity in gene expression during spore germination (in YPD medium) of spores pre-incubated in glucose or 'nitrogen'. Correlations with normal germination (without pre-incubation, see Figure 2a) are also presented here. *Correlations are color-coded according to the bar shown. (c) Enlargements of the parts marked in circles in the correlation matrix presented in (b).
Figure 8
Figure 8
Glucose induces spores to enter the cell cycle. Spores (prepared from the diploid strain DS1) were pre-incubated in (a) glucose or (b) 'nitrogen' for one to five hours and then transferred to rich medium (YPD). Budding index was measured as described before. Time of pre-incubation for each line is in the legend. Black line represents pre-incubation in water.
Figure 9
Figure 9
Distinct regulatory pattern during spore germination of genes that are co-regulated during vegetative cell cycle. Expression pattern of genes in G1/S module [16] during (a) the mitotic cell cycle in cdc28-13 cells [47] and (b) spore germination. Genes were clustered [48] according to their expression during spore germination. Expression patterns are shown as log2 ratios, and are color-coded according to the bar shown. Note the difference in time scales between (a) and (b), and that the first cell cycle in germinating spores (b) starts relatively late, after approximately four hours (Figure 1).
Figure 10
Figure 10
Cdc10-GFP protein dynamics throughout spore germination. Purified spores containing GFP-tagged Cdc10 (prepared from strain DS38) were plated and synthetic minimal medium was added to allow spore germination. Time lapse microscopy was carried out using a Deltavision RT microscope system with OAI Scan command and the results deconvolved. (a-c) Spore germination before the appearance of the first bud. Images were monitored at 60× magnification using (a) FITC (excitation 490 and emission 526) filter, (b) RD-TR-Cy3 (excitation 555 and emission 617) filter and (c) merged pictures of (a) and (b). (d) The first mitotic cell cycle was monitored at 100× magnification using a FITC filter. In yellow is the time following the addition of synthetic minimal medium in hours and minutes.
Figure 11
Figure 11
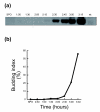
Early accumulation of Clb2 protein. Purified spores containing HA-tagged Clb2 (prepared from strain DS35) were transferred to rich medium to allow spore germination. At the indicated time, samples were taken for (a) western blot analysis and (b) budding index analysis.
Figure 12
Figure 12
Events occurring during spore germination. Our results suggest that spore germination can be divided into two major stages. Stage I is induced by glucose alone whereas for the transition to stage II other nutrients are necessary. Mitotic cell cycle machinery is involved in spore germination but, in contrast to the cell cycle, growth related events are regulated separately from nuclear events. A model for activation of cell cycle events that occur during stage II of germination is suggested at the lower part of the figure. See Discussion for more details. Septin (Cdc10) is depicted in green. Auto-fluorescence of the spore is depicted in red.

References

    1. Hara K, Tydeman P, Kirschner M. A cytoplasmic clock with the same period as the division cycle in Xenopus eggs. Proc Natl Acad Sci USA. 1980;77:462–466. doi: 10.1073/pnas.77.1.462. - DOI - PMC - PubMed
    1. Nasmyth K. At the heart of the budding yeast cell cycle. Trends Genet. 1996;12:405–412. doi: 10.1016/0168-9525(96)10041-X. - DOI - PubMed
    1. Grandin N, Reed SI. Differential function and expression of Saccharomyces cerevisiae B-type cyclins in mitosis and meiosis. Mol Cell Biol. 1993;13:2113–2125. - PMC - PubMed
    1. Chen KC, Csikasz-Nagy A, Gyorffy B, Val J, Novak B, Tyson JJ. Kinetic analysis of a molecular model of the budding yeast cell cycle. Mol Biol Cell. 2000;11:369–391. - PMC - PubMed
    1. Herman PK, Rine J. Yeast spore germination: a requirement for Ras protein activity during re-entry into the cell cycle. EMBO J. 1997;16:6171–6181. doi: 10.1093/emboj/16.20.6171. - DOI - PMC - PubMed

Publication types