Review
. 2008 Jan 4;375(1):12-9.
doi: 10.1016/j.jmb.2007.10.046. Epub 2007 Oct 23.

DNA combing reveals intrinsic temporal disorder in the replication of yeast chromosome VI

Affiliations
Review

DNA combing reveals intrinsic temporal disorder in the replication of yeast chromosome VI

Daniel M Czajkowsky et al. J Mol Biol. .

Abstract

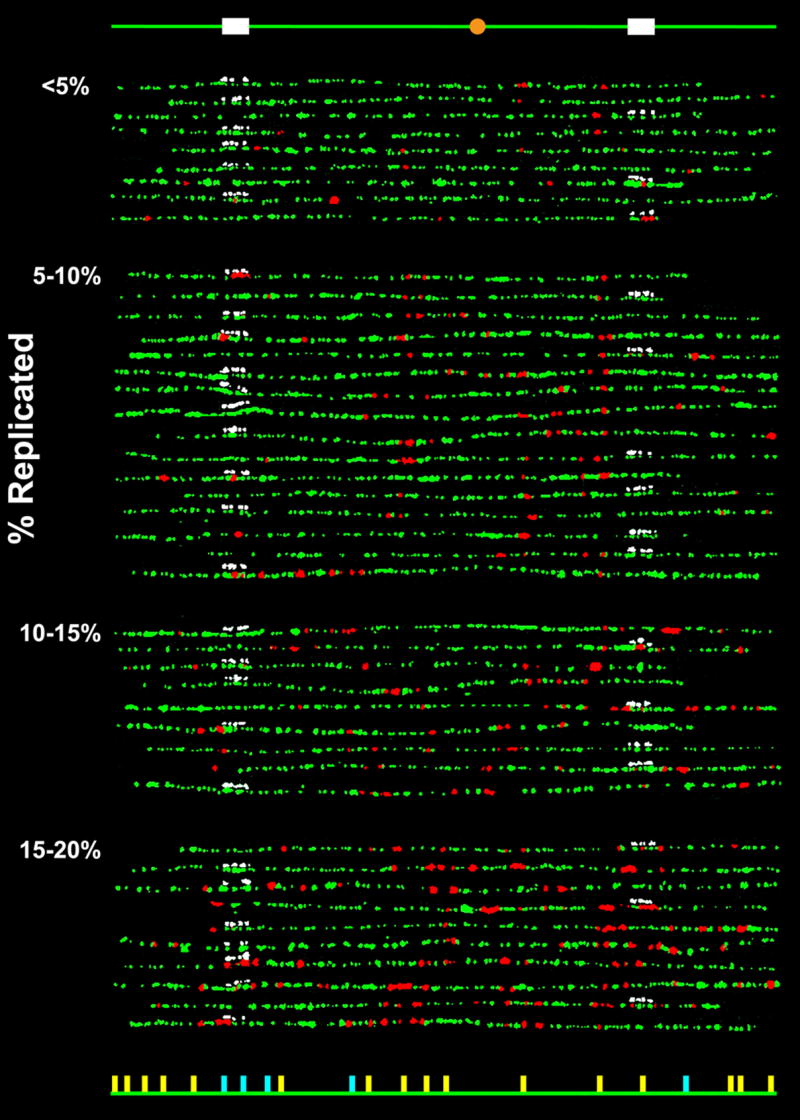
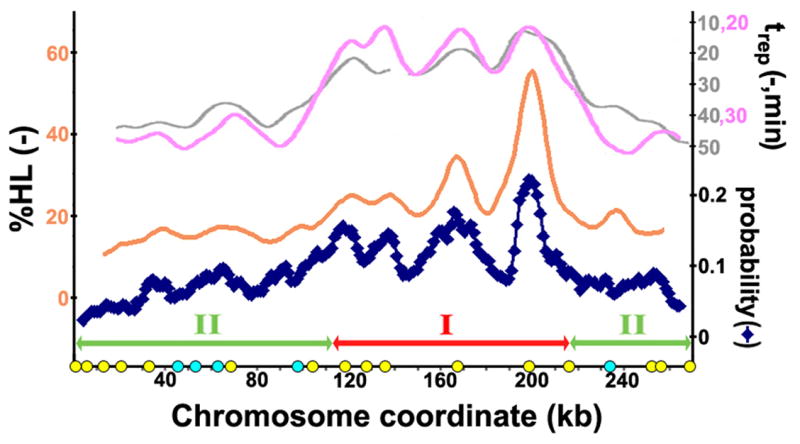
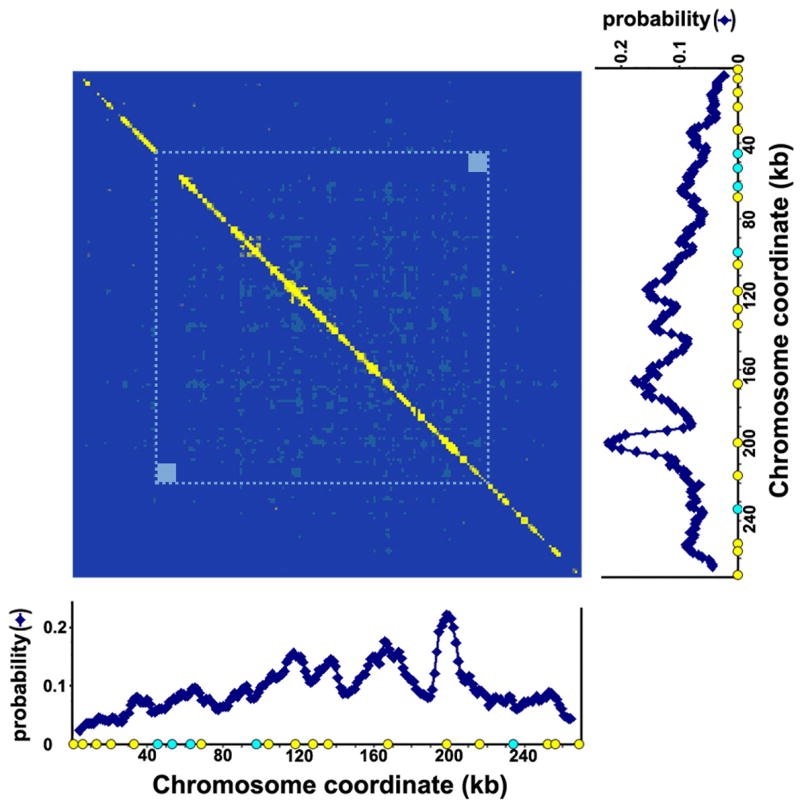
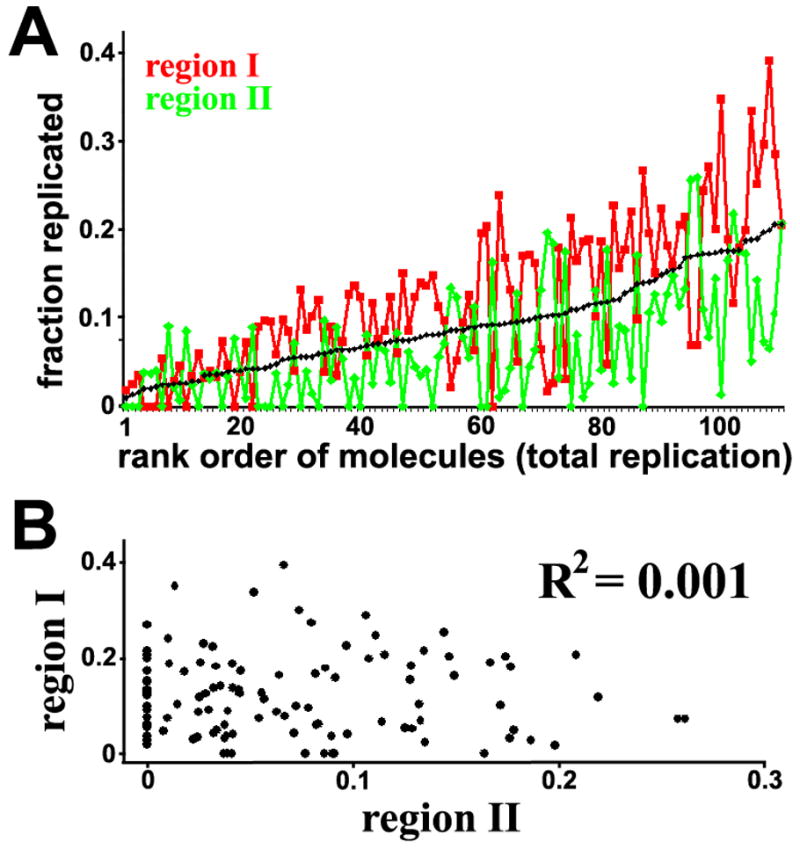
It is generally believed that DNA replication in most eukaryotes proceeds according to a precise program in which there is a defined temporal order by which each chromosomal region is duplicated. However, the regularity of this program at the level of individual chromosomes, in terms of both the relative timing and the size of the DNA domain, has not been addressed. Here, the replication of chromosome VI from synchronized budding yeast was studied at a resolution of approximately 1 kb with DNA combing and fluorescence microscopy. Contrary to what would be expected from cells following a rigorous temporal program, no two molecules exhibited the same replication pattern. Moreover, a direct evaluation of the extent to which the replication of distant chromosomal segments was coordinated indicates that the overwhelming majority of these segments were replicated independently. Importantly, averaging the patterns of all the fibers examined recapitulates the ensemble-averaged patterns obtained from population studies of the replication of chromosome VI. Thus, rather than an absolutely defined temporal order of replication, replication timing appears to be essentially probabilistic within individual cells, exhibiting only temporal tendencies within extended domains.


Figures

Figure 1
Figure 1
Replication patterns of individual chromosome VI molecules from α-factor synchronized budding yeast cells pulse-labeled during early S-phase with BrdU. Combed molecules were labeled by fluorophore-conjugated antibodies for BrdU (red) and DNA (green) as well as fluorophore-conjugated avidin (white) for the biotinylated hybridization probes to one of the two 10kb regions. The molecules were grouped according to their replication extent (indicated on the left). The schematic diagram at the top indicates the locations along the chromosome of the probes (white) and the centromere (orange), and the diagram at the bottom indicates the locations of the “confirmed” (yellow) and “potential” (light blue) origins. An origin is designated as “confirmed” if it has been identified in more than one of the previous mapping studies; –; – and “potential” if it has been identified only in a single study. It should be noted that there appears to be evidence in these patterns for previously unidentified origins, but most of these correlate with the locations of motifs found to be associated with origins,. A detailed analysis of this aspect of the data will be provided in a subsequent publication. The complete dataset is shown in Supplementary Fig. S2. The strain used here (provided by K. Nasmyth) is K5409 (MATa ho ade2-1 trp1-1 can1-100 leu2-3, 112 his 3-11,15 ssd1 clb1-4ts ura3::URA3/GPD-TK). Cells were grown at 25°C in YPD to an OD600 of 0.5 and then incubated with α-factor (8μg/ml, GenScript) for 2.5hr. BrdU (Sigma) was added to a final concentration of 0.4mg/ml and 10 min later, the cells were released from the α-factor block with the addition of pronase (50μg/ml, Sigma). The cells were then washed with YPD 5 min after α-factor release to remove BrdU and then 30 min later, nocodazole (10μg/ml, Sigma) was added to arrest the cells, with fully replicated chromosomes, at the G2/M phase 2.25hr later. Nocodazole-arrested cells were recovered by centrifugation, resuspended in 10mM EDTA (pH 8.0), pelleted, and then resuspended in sorbitol buffer (1.0M sorbitol, 0.1M EDTA, 50mM DTT, pH 7.5) containing 0.7mg/ml lyticase at 37°C for 1hr. The cells were then pelleted, resuspended in sorbitol buffer, and mixed with an equal volume of 1.5% low-melting agarose (Bio-Rad) and cooled until the agarose had solidified, after which the plugs were incubated overnight at 37°C in 1mg/ml proteinase K (Bioline), 1% N-lauroylsarcosine, 0.5M EDTA, pH 9. Each plug contained roughly 108 cells. Pulse-field gel electrophoresis was performed in a 1% low-melting agarose gel. The band containing chromosome VI was excised, digested with β-agarase (New England Biolabs), and the DNA solution was then dialyzed overnight at 4°C in 5mM Tris, 1mM EDTA, pH8.0, using 100,000-molecular-weight-cutoff dialysis membrane (Spectrum). The solution was then adjusted to 0.2M MES, 5mM EDTA, pH 5.5 for DNA combing. To avoid DNA breakage, the purified DNA solution was handled with care to minimize shear. The glass slides onto which DNA molecules were combed were coated with octadecyltrichlorosilane (Sigma). The combed DNA molecules were denatured in 1M NaOH for 30min at room temperature, and hybridization was performed in 50% formamide, 1xSSC, 0.005% Tween 20, for 2hrs in the presence of 1μg/ml sheared salmonsperm DNA, 4μg/ml poly-uridine, 3μg/ml biotinylated probes at 37°C. The probe templates, prepared with PCR, covered one of two 10kb regions (only one of the regions, but not both, is used on each slide, except for distance calibration), in three blocks of ~2kb, 3kb, and 5kb: 45013–47023, 47051–52012, 52016–55231 and 210748–212827, 212915–217877, 217897–220277. The biotinylated probes were generated by random priming using BioPrime (Invitrogen). After incubation with Roche Blocking solution (Roche Biochemicals) for 30min, an alternating series of 45min incubations with (1/50 dilution) Alexa Fluor 350-neutrAvidin (Invitrogen) and (1/100 dilution) biotinylated anti-avidin antibodies (Vector Labs) labeled the probes. In total, there were 4 incubations with neutrAvidin and 3 incubations with biotinylated anti-avidin antibodies. The final set of incubations was: (1/50 dilution) anti-BrdU IgG (BU1/75 rat monoclonal, Abcam) for 1.5hrs, (1/70 dilution) Alexa Fluor 594-anti-rat IgG (rabbit, Invitrogen) for 1hr, (1/12 dilution) anti-ssDNA IgG (mouse, Argene) for 3hrs and then (1/30 dilution) Alexa Fluor 488-anti-mouse IgG (chicken, Invitrogen) for 1hr. All were carried out at room temperature. After all incubations, the sample was thoroughly washed with PBS. The sample was then fixed with 2% glutaraldehyde for 10min, and imaged in an anti fade solution (5.5% DABCO/45% glycerol (PBS)). Images were acquired using a Zeiss Axiovert S100 microscope equipped with a QImaging Retiga 1350EX CCD camera (25°C below ambient) and a 100× (NA=1.3) objective. The images were processed with Photoshop (Adobe), applying the same contrast/brightness adjustments (to the whole image) for all same-colored images. DNA lengths were calibrated using lambda phage DNA and chromosome VI molecules in which probes to both 10kb regions were used (data not shown).
Figure 2
Figure 2
Comparison of the averaged replication pattern of the individual chromosomes with the previously determined population-averaged replication profiles., , Shown in gray is the replication profile from a density-transfer study, while the profile in pink is a copy-number study and that in orange is a recently determined replication profile (also using the density-transfer method) obtained after 12.5min in S phase, which is the time at which there was a similar amount of replication as the average extent of replication in the collection of molecules studied here (10%). Note that the scales for the different plots are shifted along the y-axis. The segmentation at the bottom is for the analysis described in Figure 4, and the circles along the x-axis are the locations of the confirmed (yellow) and potential (light blue) origins along this chromosome, as described in Fig. 1. To obtain this average of the single molecule patterns (dark blue), the molecules first were digitized by segmenting them into 1.25kb intervals and assigning a numerical value to each segment according to whether each interval was replicated, not replicated, or whether there was a gap. The average of each segment was then obtained, and then a 10kb moving average was calculated to enable a better comparison with the previous replication profiles, which were averaged over a similar size. Overall, the average of these molecules is consistent with the replication profiles from the previous studies employing ensemble-averaging techniques.
Figure 3
Figure 3
Chromosome-wide evaluation of replication coordination between every pair of ~1kb segments along the chromosome. The number of molecules in which a given pair of segments were both replicated during the pulse period was directly counted, as was the total number of molecules in which there was data for the given regions (that is, the number of molecules in which there was data indicating that the regions were replicated or not replicated), and then this frequency was compared with what might be expected if the replication of the two regions is independent. The latter was determined with a binomial test, which gives a measure of the likelihood of obtaining the actual number of observations, given a certain total number of observations and the probability of their occurrence. In the present case, the probability of observing two regions replicated in the same molecule if their replication is independent is simply given by the product of their individual probabilities, as determined in Fig. 2 (before applying the moving average). It should be noted that only those segments for which there was data are included in this analysis, and so the absence of data, whether owing to gaps or missing regions at the chromosome ends, only affect this analysis in reducing the total number of pairs analyzed for a given region. In this figure, the intersection of a given pair of segments was colored according to (1) whether or not the number of molecules in which both segments were replicated was greater than that of the mean expected value (the product of the total number of molecules and the probability) and (2) whether or not the likelihood of observing this number of molecules is extremely low if their replication is independent (by convention, P<0.05). For those pairs of segments observed to be replicated on the same molecule more (less) frequently than the mean expected value and whose likelihood of observing this number of molecules is extremely low, the intersection is colored yellow (red). For those pairs replicated on the same molecule more (less) frequently than the mean expected value, but not more (less) than what might be expected from a typical measurement with this total number of molecules, the intersection of the two regions is colored dark (light) blue. The dotted blue line indicates the region within which there is data from all of the molecules included here. Owing to the missing segments at the end of a chromosome in some of the molecules, the statistical significance is slightly lower outside of this boundary, but the conclusion is the same. The small squares at the corners within this demarcated region are locations for which there is no data concerning replication coordination in the present dataset: in every molecule, one of the two corresponding regions was bound by hybridized probes, and so there are no molecules in this set for which the binding of the anti-BrdU antibody to both regions was not obscured. Clearly, the overwhelming majority of pairs of segments are replicated independently, with only the nearest neighbors in a few regions exhibiting some coordination, which is likely owing to their replication by a common fork.
Figure 4
Figure 4
Evaluation of the temporal order of replication in the single molecules in terms of chromosomal domains. The chromosomes were segmented into two types of regions depending on their frequency of replication as indicated in Fig. 2, and the replication extent in each region was individually calculated. These values for each molecule are plotted along the vertical axis in Figure 4A, with the molecules arranged along the horizontal axis in rank order of their total replication extent (the value of which is also plotted in the figure in black). A. Overall, most of the molecules do exhibit the expected tendency, I > II. Nonetheless, ~27% do not, indicating that this is not a strict feature of the replication process. The plot in black is the total replication extent for each molecule. B. The correlation coefficient associated with the extent of replication in region I compared with that in region II is exceedingly small, indicating that the replication of each region is essentially not correlated. This coefficient was calculated using Excel.

Similar articles

Cited by

References

    1. Goren A, Cedar H. Replicating by the clock. Nat Rev Mol Cell Biol. 2003;4:25–32. - PubMed
    1. Balazs I, Brown EH, Schildkraut CL. The temporal order of replication of some DNA cistrons. Cold Spring Harb Symp Quant Biol. 1974;38:239–45. - PubMed
    1. Braunstein JD, Schulze D, DelGiudice T, Furst A, Schildkraut CL. The temporal order of replication of murine immunoglobulin heavy chain constant region sequences corresponds to their linear order in the genome. Nucleic Acids Res. 1982;10:6887–902. - PMC - PubMed
    1. Bell SP, Dutta A. DNA replication in eukaryotic cells. Annu Rev Biochem. 2002;71:333–74. - PubMed
    1. Mendez J, Stillman B. Perpetuating the double helix: molecular machines at eukaryotic DNA replication origins. Bioessays. 2003;25:1158–67. - PubMed

Publication types