

doi: 10.1098/rsif.2007.1218.
Individual space-time activity-based modelling of infectious disease transmission within a city
Affiliations
- PMID: 17999949
- PMCID: PMC2607451
- DOI: 10.1098/rsif.2007.1218
Item in Clipboard
Individual space-time activity-based modelling of infectious disease transmission within a city
J R Soc Interface.
.
Abstract
This paper provides an example of the application of an individual space-time activity-based model (ISTAM) to the simulation of the transmission of infectious disease in Eemnes, a city in The Netherlands. Four questions were addressed: (i) how to build the whole population at the city level, (ii) how to build the structure of the activity bundles for the city, (iii) how to assign daily activity patterns to each individual, and (iv) how to simulate within-AB transmission. The model was calibrated and examples of simulation results such as dynamics of the population during a whole day, infection distribution and network analysis are presented.
Figures
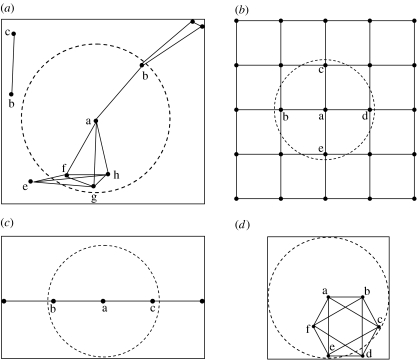
Spatial patterns of individuals within groups: (a) static random, (b) static even, (c) queue and (d) loop. (The points represent individuals. The solid lines that link between two points represent the possible contacts between these two individuals. Dotted circular line around individual ‘a’ shows all individuals within this area who could come into contact with individual ‘a’.)
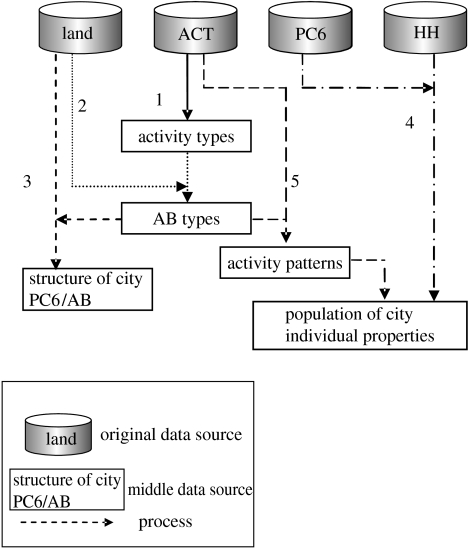
Preparation process (see table 6 for data sources).
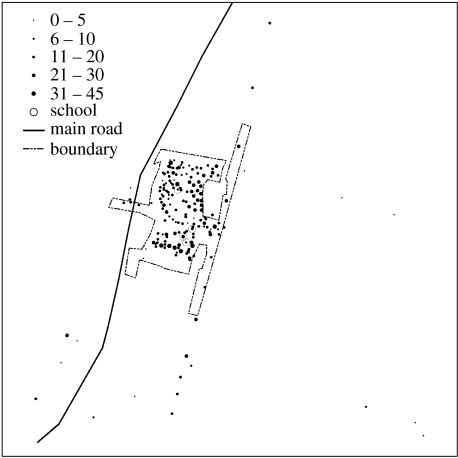
Spatial distribution of households and schools at PC6 levels. Solid black circles indicate PC6 with a school.
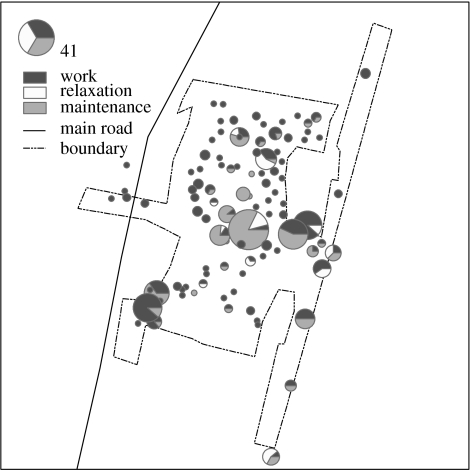
Spatial distribution of ABs for work, relaxation and maintenance at PC6 levels.
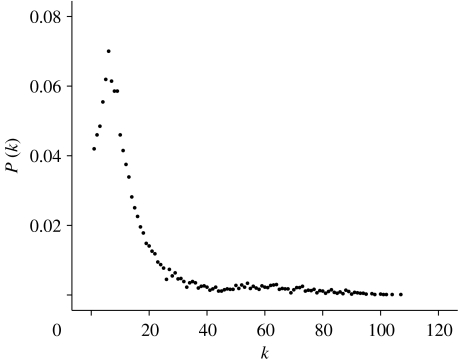
Distribution of number of contacts for all individuals per day.
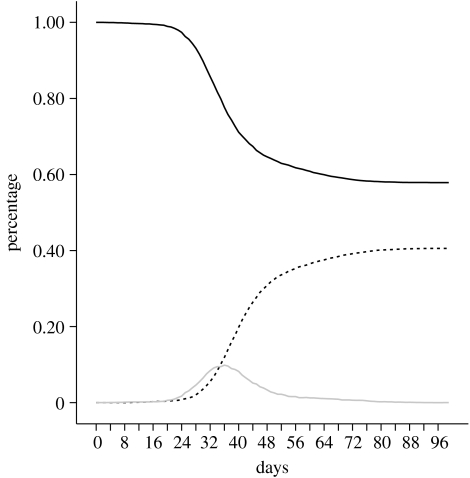
SIR plot for one simulation of 100 days (black line, susceptible; dotted line, immune infected).
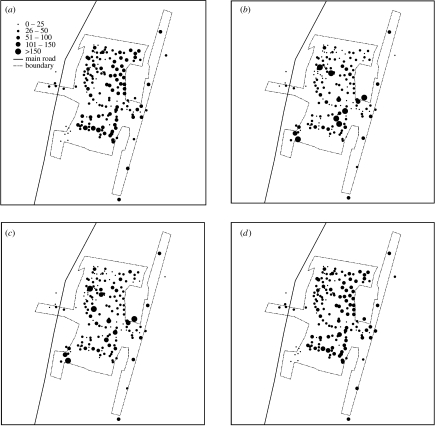
Individuals' spatial distribution at (a) 04.00, (b) 10.00, (c) 16.00 and (d) 22.00 hours.
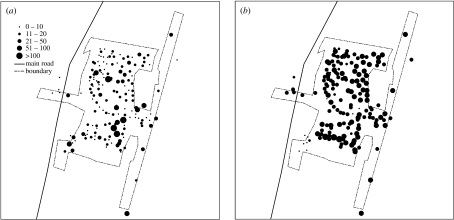
Spatial distributions of infections at PC6 level (a) based on the AB where infections occurred and (b) based on the households of infected persons.
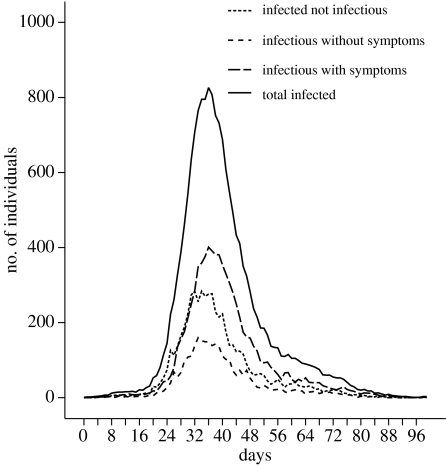
Change over time in the number of individuals infected but not infectious, infectious without symptoms, infectious with symptoms and the total number of infected individuals.
Similar articles
-
Arthropod Vectors and Disease Transmission: Translational Aspects.PLoS Negl Trop Dis. 2015 Nov 19;9(11):e0004107. doi: 10.1371/journal.pntd.0004107. eCollection 2015 Nov. PLoS Negl Trop Dis. 2015. PMID: 26583380 Free PMC article. No abstract available.
-
Urbanisation and infectious diseases in a globalised world.Lancet Infect Dis. 2011 Feb;11(2):131-41. doi: 10.1016/S1473-3099(10)70223-1. Lancet Infect Dis. 2011. PMID: 21272793 Free PMC article. Review.
-
Modelling the effect of urbanization on the transmission of an infectious disease.Math Biosci. 2008 Jan;211(1):166-85. doi: 10.1016/j.mbs.2007.10.007. Epub 2007 Nov 4. Math Biosci. 2008. PMID: 18068198
-
Prioritising clean water and sanitation.Lancet Infect Dis. 2015 Feb;15(2):153-4. doi: 10.1016/S1473-3099(15)70012-5. Epub 2015 Jan 19. Lancet Infect Dis. 2015. PMID: 25749065 No abstract available.
-
What Is Stopping the Use of Genetically Modified Insects for Disease Control?PLoS Pathog. 2016 Oct 6;12(10):e1005830. doi: 10.1371/journal.ppat.1005830. eCollection 2016 Oct. PLoS Pathog. 2016. PMID: 27711161 Free PMC article. Review. No abstract available.
Cited by
-
Spatial-temporal transmission of influenza and its health risks in an urbanized area.Comput Environ Urban Syst. 2010 May;34(3):204-215. doi: 10.1016/j.compenvurbsys.2010.03.004. Epub 2010 Apr 7. Comput Environ Urban Syst. 2010. PMID: 32287709 Free PMC article.
-
Agent-based Modeling in Tobacco Regulatory Science: Exploring 'What if' in Waterpipe Smoking.Tob Regul Sci. 2020 May;6(3):171-178. doi: 10.18001/trs.6.3.1. Tob Regul Sci. 2020. PMID: 32582820 Free PMC article.
-
Little Italy: an agent-based approach to the estimation of contact patterns- fitting predicted matrices to serological data.PLoS Comput Biol. 2010 Dec 2;6(12):e1001021. doi: 10.1371/journal.pcbi.1001021. PLoS Comput Biol. 2010. PMID: 21152004 Free PMC article.
-
Influenza spread on context-specific networks lifted from interaction-based diary data.R Soc Open Sci. 2021 Jan 27;8(1):191876. doi: 10.1098/rsos.191876. eCollection 2021 Jan. R Soc Open Sci. 2021. PMID: 33614059 Free PMC article.
-
A Multi-Host Agent-Based Model for a Zoonotic, Vector-Borne Disease. A Case Study on Trypanosomiasis in Eastern Province, Zambia.PLoS Negl Trop Dis. 2016 Dec 27;10(12):e0005252. doi: 10.1371/journal.pntd.0005252. eCollection 2016 Dec. PLoS Negl Trop Dis. 2016. PMID: 28027323 Free PMC article.
References
-
- Anderson R.M, May R.M. Oxford University Press; Oxford, UK: 1992. Infectious diseases of humans: dynamics and control.
-
- Arentze T, Timmermans H. Parametric action decision trees: incorporating continuous attribute variables into rule-based models of discrete choice. Transport. Res. B: Methodol. 2007;41:772–783. doi: 10.1016/j.trb.2007.01.001. - DOI
-
- Baldassare M. Human spatial behavior. Annu. Rev. Sociol. 1978;4:29–56. doi: 10.1146/annurev.so.04.080178.000333. - DOI
-
- Batty M. Agent-based pedestrian modelling. In: Longley P.A, Batty M, editors. Advanced spatial analysis: the CASA book of GIS. ESRI Press; Redlands, CA: 2003. pp. 81–105.
-
- Batty M. Agents, cells, and cities: new representational models for simulating multiscale urban dynamics. Environ. Plann. A. 2005a;37:1373–1394. doi: 10.1068/a3784. - DOI
MeSH terms
LinkOut - more resources
Full Text Sources
Medical
