. 2008 Feb;52(2):684-93.
doi: 10.1128/AAC.00874-07. Epub 2007 Nov 12.

Mefloquine-induced disruption of calcium homeostasis in mammalian cells is similar to that induced by ionomycin

Affiliations

Mefloquine-induced disruption of calcium homeostasis in mammalian cells is similar to that induced by ionomycin

D Caridha et al. Antimicrob Agents Chemother. 2008 Feb.

Abstract

In previous studies, we have shown that mefloquine disrupts calcium homeostasis in neurons by depletion of endoplasmic reticulum (ER) stores, followed by an influx of external calcium across the plasma membrane. In this study, we explore two hypotheses concerning the mechanism(s) of action of mefloquine. First, we investigated the possibility that mefloquine activates non-N-methyl-d-aspartic acid receptors and the inositol phosphate 3 (IP3) signaling cascade leading to ER calcium release. Second, we compared the disruptive effects of mefloquine on calcium homeostasis to those of ionomycin in neuronal and nonneuronal cells. Ionomycin is known to discharge the ER calcium store (through an undefined mechanism), which induces capacitative calcium entry (CCE). In radioligand binding assays, mefloquine showed no affinity for the known binding sites of several glutamate receptor subtypes. The pattern of neuroprotection induced by a panel of glutamate receptor antagonists was dissimilar to that of mefloquine. Both mefloquine and ionomycin exhibited dose-related and qualitatively similar disruptions of calcium homeostasis in both neurons and macrophages. The influx of external calcium was blocked by the inhibitors of CCE in a dose-related fashion. Both mefloquine and ionomycin upregulated the IP3 pathway in a manner that we interpret to be secondary to CCE. Collectively, these data suggest that mefloquine does not activate glutamate receptors and that it disrupts calcium homeostasis in mammalian cells in a manner similar to that of ionomycin.


Figures
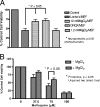
FIG. 1.
FIG. 1.
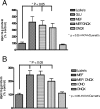
DNQX and magnesium at high concentrations protect neurons (A) and magnesium at high concentrations protects macrophages (B) from mefloquine-induced toxicity. Neurons and macrophages were exposed to neuroprotective agents (1.2, 12, and 100 mM MgCl2 and 100 μM DNQX) for 5 min and then with 20 μM mefloquine (MEF) for 20 min. Bars represent means ± standard errors of the means (SEMs) for three pooled experiments containing three replicates per condition (nine experiments per condition). For the data in panel A, single-factor ANOVA was used to determine whether differences in group means existed across the experiment. Differences between the individual group means and values for the mefloquine control were determined using Dunnett's test, with statistical significance (P < 0.05) indicated by *. For data in panel B, an unpaired two-tailed t test was used to evaluate whether there was a statistically significant difference between means in pretreated and nonpretreated groups at 75 μM mefloquine (P < 0.05).
FIG. 2.
FIG. 2.
Effects of 100 μM DNQX and 12 mM MgCl2 on calcium homeostasis in neurons treated with 50 μM mefloquine (A and B) and macrophages treated with 100 μM mefloquine (C and D). The effect of 100 μM DNQX and 12 mM MgCl2 on calcium homeostasis was investigated using confocal microscopy. The horizontal axis represents time (in minutes). Cells were loaded with the calcium-sensitive dye Fluo-3 and were scanned at 10-s intervals. The vertical axis represents 530-nm-wavelength fluorescence (F530) normalized to the first value measured for each cell. Arrows show additions of Locke's solution-DMSO, 100 μM DNQX, or 12 mM MgCl2 at scan 3. Mefloquine was added at scan 18. Images from 5 to 8 neurons and 10 to 12 macrophages were collected in a single experiment. Each experiment was repeated three times each session, and data represent pooled data from nine sessions performed during three consecutive weeks. Traces represent the means ± SEMs for 45 to 72 neurons and 90 to 108 macrophages.
FIG. 3.
FIG. 3.
Neuroprotective effect of magnesium and DNQX on the neurotoxic effects of mefloquine isomers. Neurons were exposed to neuroprotective agent for 5 min and then to mefloquine isomers for 20 min. Each week, there were four to six replicates for each plate. Data are pooled from three replicate experiments, done in three consecutive weeks. Bars represent means ± SEMs for a total of 12 to 18 replicates for each experimental condition. Single-factor ANOVA was used to determine whether differences in group means existed across the experiment. Differences between values for the individual group means and the mefloquine control were determined using Dunnett's test. Statistical significance (P < 0.05) is indicated by *. ErythroSR-20, (−)erythro isomer of mefloquine; MG1.2 and MG12, 1.2 and 12 mM MgCl2, respectively; Threo187163 - 50, (+)erythro isomer of mefloquine.
FIG. 4.
FIG. 4.
Mefloquine and ionomycin at their IC50s upregulate the IP(n) response in neurons (A), and ionomycin has a similar effect in macrophages (B). DNQX does not affect IP3 upregulation caused by these agonists. Neurons and macrophages were exposed to a neuroprotective agent (100 μM DNQX or the control [DMSO]) for 5 min and then to agonists (20 μM mefloquine [MEF] and 100 μM glutamate [GLU] for neurons and 50 μM mefloquine and 1.8 μM ionomycin [IONO] for macrophages) for 20 min. Each week, there were four to six replicates for each plate. Data are pooled from three replicate experiments, performed in three consecutive weeks. Bars represent means ± SEMs from a total of 12 to 18 replicates for each experimental condition. Single-factor ANOVA was used to determine whether differences in group means existed across the experiment. Differences between the individual group means and the mefloquine control means were determined using Dunnett's test. Statistical significance (P < 0.05) is indicated by *.
FIG. 5.
FIG. 5.
Mefloquine disrupts calcium homeostasis in a dose-dependent manner in neurons (A) and macrophages (B). Ionomycin induces a similar effect in neurons (C) and macrophages (D). The effect of different concentrations (indicated numbers in micromolar units) of mefloquine (MEF) and ionomycin (IONO) in calcium homeostasis was investigated using confocal microscopy. The horizontal axis represents time (in seconds). Cells were loaded with the calcium-sensitive dye Fluo-3 and were scanned at 10-s intervals. The vertical axis represents 530-nm-wavelength fluorescence (F 530) normalized to the first value measured for each cell. Arrows show the addition of Locke's solution-DMSO, ionomycin, or mefloquine at scan 3. For greater clarity, error bars are shown only in the line that represents the highest antagonist concentration, but the errors are all of similar relative sizes for all other agonist concentrations. Images from 5 to 8 neurons and 10 to 12 macrophages were collected in a single experiment. Each experiment was repeated two to three times each week, for three consecutive weeks. Lines represent means ± SEMs for 30 to 72 neurons and 60 to 108 macrophages.
FIG. 6.
FIG. 6.
Effects of different MgCl2 concentrations on calcium homeostasis in macrophages treated with 100 μM mefloquine (A) and 1.8 μM ionomycin (B). The effect of different MgCl2 concentrations on calcium homeostasis was investigated using confocal microscopy. The horizontal axis represents time (in minutes). Cells were loaded with the calcium-sensitive dye Fluo-3 and were scanned at 10-s intervals. The y axis represents 530-nm-wavelength fluorescence (F 530) normalized to the first value measured for each cell. Arrows show additions of Locke's solution; 1.2, 12, and 100 mM MgCl2 at scan 3; and mefloquine or ionomycin at scan 18. For clarity purposes, error bars were shown only on the lines that represent control (Locke's solution) treatments, but the errors are all similar in size. Images from 10 to 12 macrophages were collected in a single experiment. Each experiment was repeated two to three times each week, for three consecutive weeks. Lines represent means ± SEMs for 60 to 108 macrophages.
FIG. 7.
FIG. 7.
Effects of 100 μM DNQX, 10 μM SKF93665, and their combination on calcium homeostasis in neurons treated with 1.8 μM ionomycin. The horizontal axis represents time (in minutes). Cells were loaded with the calcium-sensitive dye Fluo-3 and were scanned at 10-s intervals. The y axis represents 530-nm-wavelength fluorescence (F 530) absorbance normalized to the first value measured for each neuron. The left arrow shows the additions of Locke's solution-DMSO, 100 μM DNQX, 10 μM SKF96365 (SKF), and the combination of both at scan 3. The right arrow shows the addition of ionomycin at scan 18. For clarity purposes, error bars were shown only on the line that represents the control treatment, but the errors are all similar in size. Images from 10 to 12 macrophages were collected in a single experiment. Each experiment was repeated two to three times each week, for three consecutive weeks. Lines represent means ± SEMs of 60 to 108 macrophages. Note that the lines representing the DNQX and SKF96365-plus-DNQX treatments overlap.
FIG. 8.
FIG. 8.
Proposed model for the mechanism of disruption of Ca2+ homeostasis by mefloquine and its similarities with ionomycin. (A) Based on the protective effect of neomycin and DNQX, we initially suspected that mefloquine activated non-NMDA receptors and the G protein-PLC-IP3 pathway. This possibility was ruled out based on receptor-binding studies and the fact that calcium homeostasis was similarly disrupted in nonneuronal cells (macrophages) that do not possess non-NMDA receptors. PIP2, phosphatidyl-inositol biphosphate; IP3R, IP3 receptor. (B) Mefloquine and ionomycin exhibit similar downstream effects on the disruption of cellular calcium homeostasis by releasing Ca2+ from ER stores and, as a result, triggering a CCE response. The relationship between the store discharge and the known and putative ionophoric properties of ionomycin and mefloquine is unclear. (C) Ionomycin acts as a mobile ion carrier. Mefloquine does not have the requisite physiochemical properties to act as a channel former that some ionophores have and probably does not act as a mobile ion carrier. Mefloquine may make membranes more permeable to calcium by virtue of the fact that the drug penetrates and accumulates in biological membranes, thereby disordering their lipid arrays. (D) Other receptors and signaling pathways might be involved in the disruption of Ca2+ homeostasis by mefloquine. Ca2+ entry through voltage-gated channels is most likely excluded as a possible mechanism, since its profile of Ca2+ entry is dissimilar to that of mefloquine. The IP3 upregulation induced by mefloquine (and ionomycin) is likely secondary to the initial disruption of calcium homeostasis. The possibility of the involvement of RyRs and SERCA cannot be excluded based on our data, but their modulation also triggers CCE. R, receptor; G, G protein.

Similar articles

Cited by

References

    1. Aarnoudse, A. L., R. H. van Schaik, J. Dieleman, M. Molokhia, M. M. van Riemsdijk, R. J. Ligthelm, D. Overbosch, I. P. van der Heiden, and B. H. Stricker. 2006. MDR1 gene polymorphisms are associated with neuropsychiatric adverse effects of mefloquine. Clin. Pharmacol. Ther. 80:367-374. - PubMed
    1. Agus, Z. S., E. Kelepouris, I. Dukes, and M. Morad. 1989. Cytosolic magnesium modulates calcium channel activity in mammalian ventricular cells. Am. J. Physiol. 256:C452-C455. - PubMed
    1. Anonymous. 1996. Guide for the care and use of laboratory animals. National Research Council, Washington, DC.
    1. Barraud de Lagerie, S., E. Comets, C. Gautrand, C. Fernandez, D. Auchere, E. Singlas, F. Mentre, and F. Gimenez. 2004. Cerebral uptake of mefloquine enantiomers with and without the P-gp inhibitor elacridar (GF1210918) in mice. Br. J. Pharmacol. 141:1214-1222. - PMC - PubMed
    1. Baudry, S., Y. T. Pham, B. Baune, S. Vidrequin, C. Crevoisier, F. Gimenez, and R. Farinotti. 1997. Stereoselective passage of mefloquine through the blood-brain barrier in the rat. J. Pharm. Pharmacol. 49:1086-1090. - PubMed

LinkOut - more resources