. 2008 Jan;36(Database issue):D707-14.
doi: 10.1093/nar/gkm988. Epub 2007 Nov 13.

Ensembl 2008

Affiliations

Ensembl 2008

P Flicek et al. Nucleic Acids Res. 2008 Jan.

Abstract

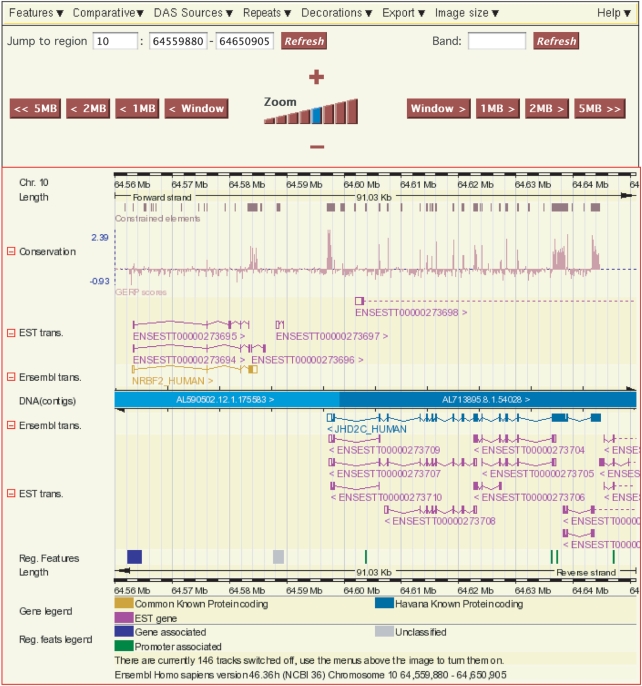
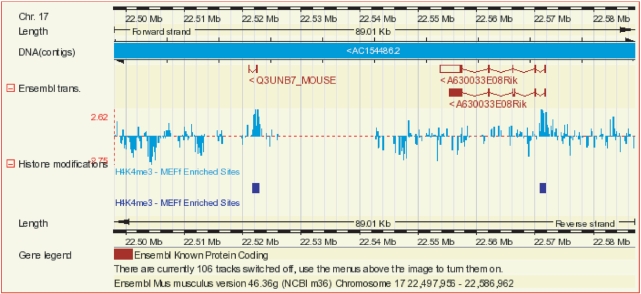
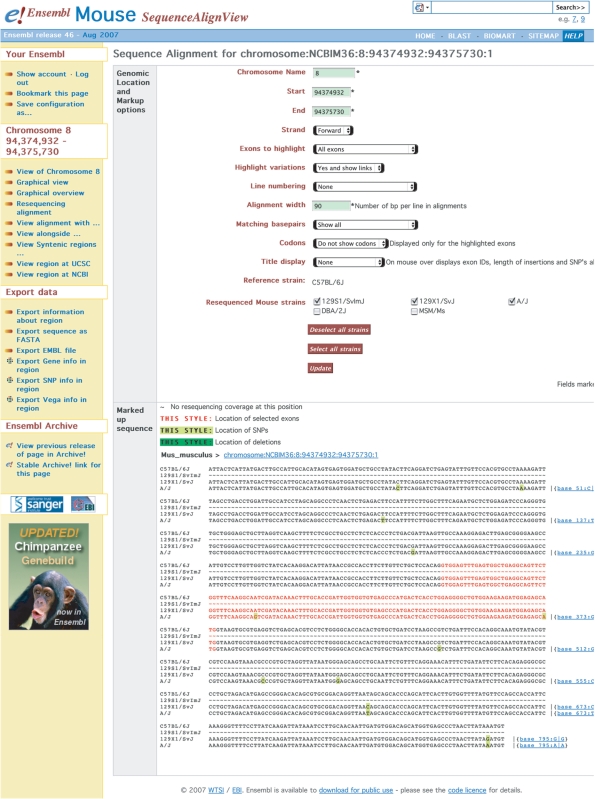
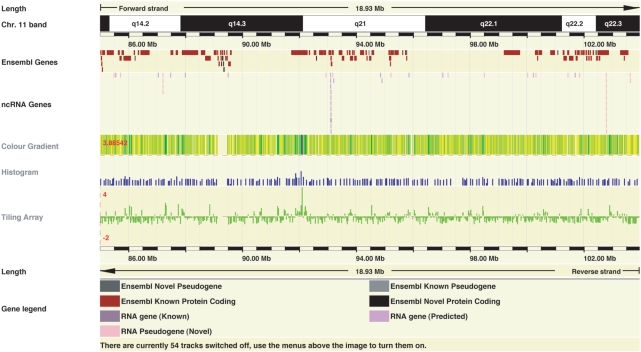
The Ensembl project (http://www.ensembl.org) is a comprehensive genome information system featuring an integrated set of genome annotation, databases and other information for chordate and selected model organism and disease vector genomes. As of release 47 (October 2007), Ensembl fully supports 35 species, with preliminary support for six additional species. New species in the past year include platypus and horse. Major additions and improvements to Ensembl since our previous report include extensive support for functional genomics data in the form of a specialized functional genomics database, genome-wide maps of protein-DNA interactions and the Ensembl regulatory build; support for customization of the Ensembl web interface through the addition of user accounts and user groups; and increased support for genome resequencing. We have also introduced new comparative genomics-based data mining options and report on the continued development of our software infrastructure.


Figures

Figure 1.
Figure 1.
The Ensembl regulatory build and GERP conservation track. A 90 kb region of human chromosome 10 showing Ensembl regulatory features in blue, green and grey on the bottom track and the GERP conservation track at the top. Note the overlap of gene-associated regulatory features with the start regions of both Ensembl transcripts and EST transcripts suggesting a complex transcriptional environment. The conservation track is a composite track that displays the constrained elements by default and both constrained elements and the GERP scores when expanded.
Figure 2.
Figure 2.
ChIP-chip display. Histone 3 lysine trimethylation data from mouse embryonic fibroblast cells (29) on mouse chromosome 17 in the region of the Q3UNB7 (ENSMUSG00000073442) and A630033E08Rik (ENSMUSG00000059142) genes. The Histone modifications display is a composite track that combines raw enrichment values and peak identifications. Displays that encompass large regions of the genome include only the identified peak regions.
Figure 3.
Figure 3.
SequenceAlignView. A full screen shot of a region on mouse chromosome 8 displaying available resequencing data from the 129S1/SvImJ, 129X1/SvJ and A/J laboratory mouse strains (the 129S1/SvImJ stain is marked as having no data in the region). Numerous display options are in the top panel on the page, which allow user to choose any region of the genomes, highlight Ensembl annotations, locations of knows SNPs and other information. The resequencing alignment in the bottom panel identifies exons in red and SNPs in yellow. Links to individual variations are provided to the right of the resequencing alignment.
Figure 4.
Figure 4.
DAS Visualizations. A 19 Mb region of human chromosome 11 showing identical data displayed with (from top to bottom) the colour gradient, histogram and tiling array ‘wiggle’ format. The colour gradient format transitions from yellow (low values) to blue (high value). The histogram display format supports merged data in bins across the genome; the display value is selectable to be either the average of the bin (shown here) or the maximum value in the bin to achieve greater data contrast. In the histogram format, the lowest value in the data set becomes the baseline. The tiling array format allows for the display of both positive and negative values with overlapping data points resulting in the maximum data point being displayed. All three display formats support in-line data normalization. The ideal format will depend on the data to be displayed. These example data are P-values from a genome-wide association study (30).

Similar articles

  • Ensembl 2009.
    Hubbard TJ, Aken BL, Ayling S, Ballester B, Beal K, Bragin E, Brent S, Chen Y, Clapham P, Clarke L, Coates G, Fairley S, Fitzgerald S, Fernandez-Banet J, Gordon L, Graf S, Haider S, Hammond M, Holland R, Howe K, Jenkinson A, Johnson N, Kahari A, Keefe D, Keenan S, Kinsella R, Kokocinski F, Kulesha E, Lawson D, Longden I, Megy K, Meidl P, Overduin B, Parker A, Pritchard B, Rios D, Schuster M, Slater G, Smedley D, Spooner W, Spudich G, Trevanion S, Vilella A, Vogel J, White S, Wilder S, Zadissa A, Birney E, Cunningham F, Curwen V, Durbin R, Fernandez-Suarez XM, Herrero J, Kasprzyk A, Proctor G, Smith J, Searle S, Flicek P. Hubbard TJ, et al. Nucleic Acids Res. 2009 Jan;37(Database issue):D690-7. doi: 10.1093/nar/gkn828. Epub 2008 Nov 25. Nucleic Acids Res. 2009. PMID: 19033362 Free PMC article.
  • Ensembl's 10th year.
    Flicek P, Aken BL, Ballester B, Beal K, Bragin E, Brent S, Chen Y, Clapham P, Coates G, Fairley S, Fitzgerald S, Fernandez-Banet J, Gordon L, Gräf S, Haider S, Hammond M, Howe K, Jenkinson A, Johnson N, Kähäri A, Keefe D, Keenan S, Kinsella R, Kokocinski F, Koscielny G, Kulesha E, Lawson D, Longden I, Massingham T, McLaren W, Megy K, Overduin B, Pritchard B, Rios D, Ruffier M, Schuster M, Slater G, Smedley D, Spudich G, Tang YA, Trevanion S, Vilella A, Vogel J, White S, Wilder SP, Zadissa A, Birney E, Cunningham F, Dunham I, Durbin R, Fernández-Suarez XM, Herrero J, Hubbard TJ, Parker A, Proctor G, Smith J, Searle SM. Flicek P, et al. Nucleic Acids Res. 2010 Jan;38(Database issue):D557-62. doi: 10.1093/nar/gkp972. Epub 2009 Nov 11. Nucleic Acids Res. 2010. PMID: 19906699 Free PMC article.
  • Ensembl variation resources.
    Chen Y, Cunningham F, Rios D, McLaren WM, Smith J, Pritchard B, Spudich GM, Brent S, Kulesha E, Marin-Garcia P, Smedley D, Birney E, Flicek P. Chen Y, et al. BMC Genomics. 2010 May 11;11:293. doi: 10.1186/1471-2164-11-293. BMC Genomics. 2010. PMID: 20459805 Free PMC article.
  • A brief introduction to web-based genome browsers.
    Wang J, Kong L, Gao G, Luo J. Wang J, et al. Brief Bioinform. 2013 Mar;14(2):131-43. doi: 10.1093/bib/bbs029. Epub 2012 Jul 3. Brief Bioinform. 2013. PMID: 22764121 Review.
  • Genome information resources - developments at Ensembl.
    Hammond MP, Birney E. Hammond MP, et al. Trends Genet. 2004 Jun;20(6):268-72. doi: 10.1016/j.tig.2004.04.002. Trends Genet. 2004. PMID: 15145580 Review.

Cited by

References

    1. International Human Genome Sequencing Consortium. Initial sequencing and analysis of the human genome. Nature. 2001;409:860–921. - PubMed
    1. Venter JC, Adams MD, Myers EW, Li PW, Mural RJ, Sutton GG, Smith HO, Yandell M, Evans CA, et al. The sequence of the human genome. Science. 2001;291:1304–1351. - PubMed
    1. Kuhn RM, Karolchik D, Zweig AS, Trumbower H, Thomas DJ, Thakkapallayil A, Sugnet CW, Stanke M, Smith KE, et al. The UCSC genome browser database: update 2007. Nucleic Acids Res. 2007;35:D668–D673. - PMC - PubMed
    1. Wheeler DL, Barrett T, Benson DA, Bryant SH, Canese K, Chetvernin V, Church DM, DiCuccio M, Edgar R, et al. Database resources of the National Center for Biotechnology Information. Nucleic Acids Res. 2007;35:D5–D12. - PMC - PubMed
    1. Sherry ST, Ward MH, Kholodov M, Baker J, Phan L, Smigielski EM, Sirotkin K. dbSNP: the NCBI database of genetic variation. Nucleic Acids Res. 2001;29:308–311. - PMC - PubMed

Publication types