. 2007 Nov 20;104(47):18363-70.
doi: 10.1073/pnas.0708865104. Epub 2007 Nov 13.

VEGF Trap complex formation measures production rates of VEGF, providing a biomarker for predicting efficacious angiogenic blockade

Affiliations

VEGF Trap complex formation measures production rates of VEGF, providing a biomarker for predicting efficacious angiogenic blockade

John S Rudge et al. Proc Natl Acad Sci U S A. .

Abstract

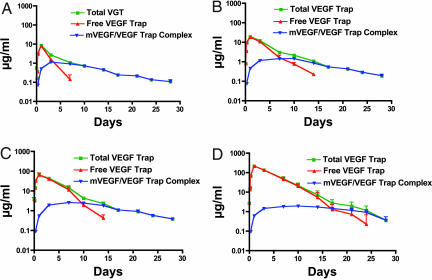
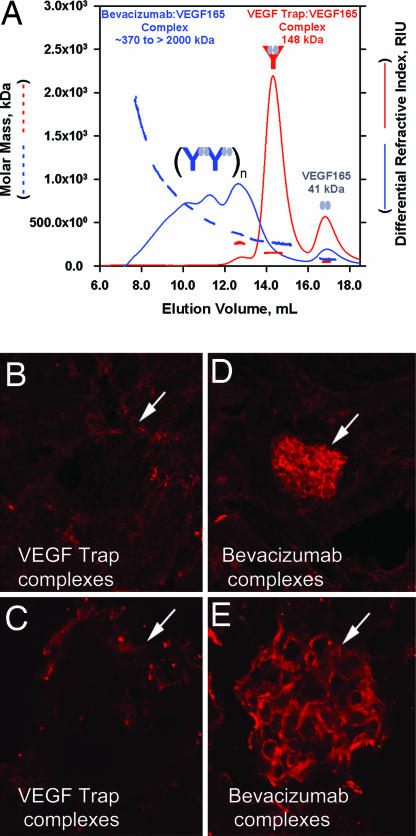
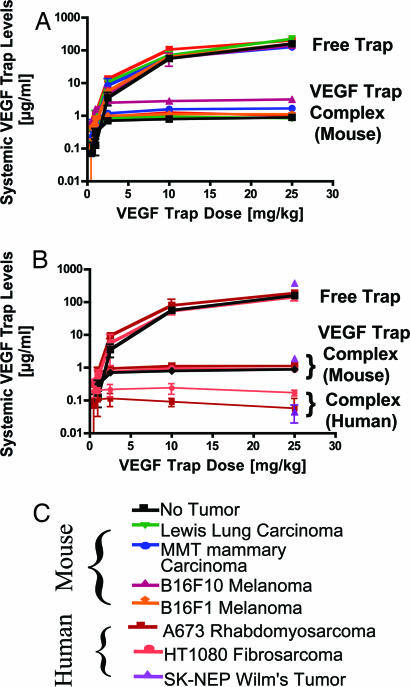
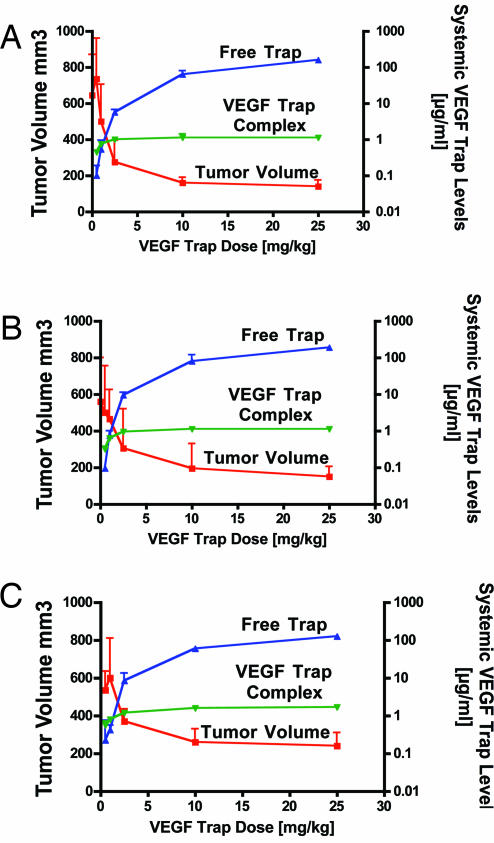
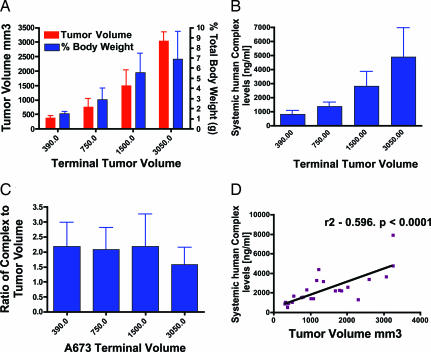
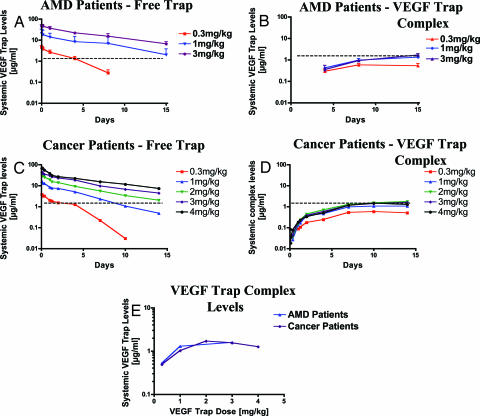
VEGF is the best characterized mediator of tumor angiogenesis. Anti-VEGF agents have recently demonstrated impressive efficacy in human cancer trials, but the optimal dosing of such agents must still be determined empirically, because biomarkers to guide dosing have yet to be established. The widely accepted (but unverified) assumption that VEGF production is quite low in normal adults led to the notion that increased systemic VEGF levels might quantitatively reflect tumor mass and angiogenic activity. We describe an approach to determine host and tumor production of VEGF, using a high-affinity and long-lived VEGF antagonist now in clinical trials, the VEGF Trap. Unlike antibody complexes that are usually rapidly cleared, the VEGF Trap forms inert complexes with tissue- and tumor-derived VEGF that remain stably in the systemic circulation, where they are readily assayable, providing unprecedented capability to accurately measure VEGF production. We report that VEGF production is surprisingly high in non-tumor-bearing rodents and humans, challenging the notion that systemic VEGF levels can serve as a sensitive surrogate for tumor load; tumor VEGF contribution becomes significant only with very large tumor loads. These findings have the important corollary that anti-VEGF therapies must be sufficiently dosed to avoid diversion by host-derived VEGF. We further show that our assay can indicate when VEGF is optimally blocked; such biomarkers to guide dosing do not exist for other anti-VEGF agents. Based on this assay, VEGF Trap doses currently being assessed in clinical trials are in the efficacious range.


Conflict of interest statement

The authors declare no conflict of interest.

Figures

Fig. 1.
Fig. 1.
s.c. injection of VEGF Trap into SCID mice at different doses reveals different levels of circulating free VEGF Trap but similar levels of circulating mouse VEGF–VEGF Trap complex. At all doses ranging from 1 mg/kg (A) to 25 mg/kg (D), a steady-state level of VEGF–VEGF Trap complex is achieved, which plateaus at ≈1 μg/ml. Dose-dependent levels of free VEGF Trap are observed as follows: 1 mg/kg to 10 μg/ml Cmax falling below complex levels at 4 days (A); 2.5 mg/kg to 20 μg/ml Cmax falling below complex levels at 7 days (B); 10 mg/kg to 80 μg/ml Cmax falling below complex levels at 9 days (C); and 25 mg/kg to 200 μg/ml Cmax falling below complex levels at 17 days (D). The half-life of VEGF Trap is ≈2 days at doses >2.5 mg/kg. (n = 6 for each dose.)
Fig. 2.
Fig. 2.
The molar masses of VEGF Trap–VEGF and bevacizumab–VEGF complexes were determined by MALLS coupled to SEC. (A) Using a 1:2 molar ratio of VEGF Trap to VEGF165, discrete peaks were observed at ≈17 ml for VEGF (41 kDa) and ≈14.5 ml for VEGF Trap–VEGF complex (148 kDa) with SEC (red line) and MALLS (dashed red line). In contrast, a 1:2 molar ratio of bevacizumab to VEGF165 revealed a heterogeneous multimeric complex that ranged in molar mass from ≈370 kDa to >2,000 kDa (SEC, solid blue line; MALLS, dashed blue line). (B–E) One milligram of a preformed complex of VEGF Trap and VEGF165 (B and C) or bevacizumab and VEGF165 (D and E) were injected into the left ventricle of 2- to 3-month-old C57bl6 mice. After 10 min, mice were killed, and their kidneys were processed for immunocytochemistry, using an anti human Fc reporter antibody to the human Fc moiety present on both VEGF Trap and bevacizumab. Significant staining was observed in the glomeruli of bevacizumab/VEGF treated mice but not in the glomeruli of VEGF Trap/VEGF treated mice (white arrows).
Fig. 3.
Fig. 3.
In mice bearing tumors <3% body weight, the tumor pool of VEGF production is modest compared with endogenous mouse tissue VEGF production. (A and B) Mouse (A) or human (B) tumors were allowed to grow to ≈100 mm3, and then VEGF Trap was administered twice per week for 1–2 weeks at 0.5, 1, 2.5, 10, and 25 mg/kg. At the termination of the experiment, free VEGF Trap, mouse, and human complex levels were measured in serum. In all cases, regardless of terminal tumor volume, levels of circulating mouse complex were ≈1 μg/ml, whereas human complex levels in the mice bearing human tumors were ≈0.1 μg/ml. Free Trap levels increased incrementally, with the dose levels rising above complex levels at the 2.5 mg/kg dose and reaching ≈100 μg/ml at the 25 mg/kg dose. (n = 6 for each dose). (C) Legend of mouse and human tumor types used.
Fig. 4.
Fig. 4.
VEGF Trap Complex provides guidance on when optimal VEGF blockade is achieved for antitumor purposes. In mice bearing B16F1 mouse melanoma tumors (A), A673 human rhabdomyosarcoma (B), and MMT mouse mammary carcinoma tumors (C) grown to ≈100 mm3 before treatment, increasing the dose of VEGF Trap from 0.5 mg/kg twice per week to 25 mg/kg twice per week results in a steady-state of mouse complex at ≈1 μg/ml at 1–2.5 mg/kg and free circulating VEGF Trap levels of ≈10 μg/ml at the 2.5 mg/kg dose, rising to ≈100 μg/ml at the 25 mg/kg dose. Tumors remain quite large at the 0.5 and 1 mg/kg doses but begin to show a significant lack of growth at the 2.5 mg/kg dose, where free Trap levels rise above steady-state complex levels (n = 6 for each dose). Tumors were treated with VEGF Trap from 6–13 (B16F1), 4–13 (MMT), and 12–18 (A673) days after implantation.
Fig. 5.
Fig. 5.
Human VEGF–VEGF Trap complex levels are directly related to tumor size. Human A673 rhabdomyosarcoma tumors were grown in mice to ≈100, ≈300, ≈500, and ≈750 mm3, at which point they were treated with a single bolus of 25 mg/kg. VEGF Trap, tumor volume, and human complex levels were measured after 2 weeks (n = 6). (A) Increasing tumor volume equates with an increase in tumor burden. (B) Increasing human tumor burden is reflected in an increase in circulating human VEGF–VEGF Trap complex. (C) The ratio of human VEGF–VEGF Trap complex to tumor volume remains steady at ≈2-fold. (D) Linear regression analysis comparing systemic levels of human VEGF–VEGF Trap to tumor volume reveals that increasing tumor volume directly correlates with increasing complex levels. (P < 0.0001.)
Fig. 6.
Fig. 6.
Circulating free VEGF Trap and human VEGF–VEGF Trap complex levels are very similar in the plasmas of AMD and cancer patients. (A and B) Patients with AMD received a single i.v. bolus of VEGF Trap at 0.3, 1, or 3 mg/kg, and free VEGF Trap and complex levels were measured at 2 and 4 h and 1, 4, 8, and 15 days (n = 7, 0.3 mg/kg; n = 7, 1 mg/kg; n = 5, 3 mg/kg). (C and D) Patients with cancer received a single i.v. bolus of VEGF Trap at 0.3, 1, 2, 3, or 4 mg/kg, and free VEGF Trap and complex levels were measured at 1, 2, 4, and 8 h and 1, 2, 4, 7, 10, and 14 days (n = 3, 0.3 mg/kg; n = 7, 1 mg/kg; n = 6, 2 mg/kg; n = 5, 3 mg/kg; n = 7, 4 mg/kg). (E) Complex levels in AMD patients at 15 days and cancer patients at 14 days were plotted against the different doses revealing an almost exact overlap. Dotted lines denote the steady-state circulating levels of VEGF–VEGF Trap complex in AMD and cancer patients.

References

    1. Ferrara N. Nat Rev Cancer. 2002;2:795–803. - PubMed
    1. Folkman J. N Engl J Med. 1971;285:1182–1186. - PubMed
    1. Kim KJ, Li B, Winer J, Armanini M, Gillett N, Phillips HS, Ferrara N. Nature. 1993;362:841–844. - PubMed
    1. Yang JC, Haworth L, Sherry RM, Hwu P, Schwartzentruber DJ, Topalian SL, Steinberg SM, Chen HX, Rosenberg SA. N Engl J Med. 2003;349:427–434. - PMC - PubMed
    1. Yang JC. Clin Cancer Res. 2004;10:6367S–6370S. - PubMed

LinkOut - more resources