

A cold phase of the East Pacific triggers new phytoplankton blooms in San Francisco Bay
- PMID: 18000053
- PMCID: PMC2141816
- DOI: 10.1073/pnas.0706151104
A cold phase of the East Pacific triggers new phytoplankton blooms in San Francisco Bay
Abstract
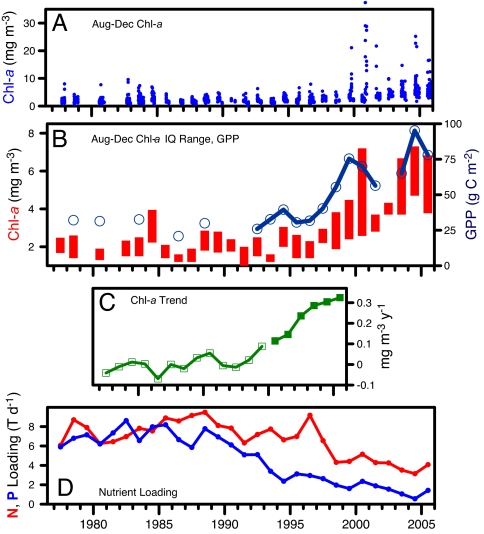
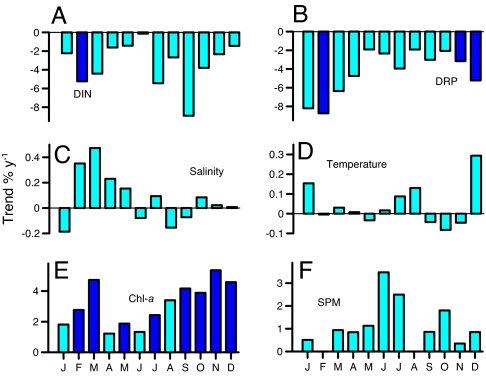
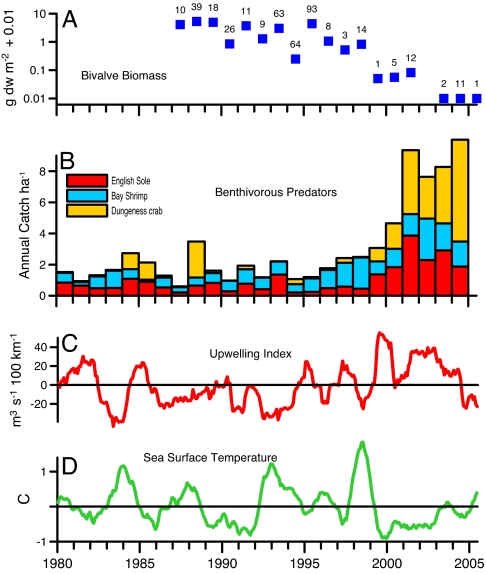
Ecological observations sustained over decades often reveal abrupt changes in biological communities that signal altered ecosystem states. We report a large shift in the biological communities of San Francisco Bay, first detected as increasing phytoplankton biomass and occurrences of new seasonal blooms that began in 1999. This phytoplankton increase is paradoxical because it occurred in an era of decreasing wastewater nutrient inputs and reduced nitrogen and phosphorus concentrations, contrary to the guiding paradigm that algal biomass in estuaries increases in proportion to nutrient inputs from their watersheds. Coincidental changes included sharp declines in the abundance of bivalve mollusks, the key phytoplankton consumers in this estuary, and record high abundances of several bivalve predators: Bay shrimp, English sole, and Dungeness crab. The phytoplankton increase is consistent with a trophic cascade resulting from heightened predation on bivalves and suppression of their filtration control on phytoplankton growth. These community changes in San Francisco Bay across three trophic levels followed a state change in the California Current System characterized by increased upwelling intensity, amplified primary production, and strengthened southerly flows. These diagnostic features of the East Pacific "cold phase" lead to strong recruitment and immigration of juvenile flatfish and crustaceans into estuaries where they feed and develop. This study, built from three decades of observation, reveals a previously unrecognized mechanism of ocean-estuary connectivity. Interdecadal oceanic regime changes can propagate into estuaries, altering their community structure and efficiency of transforming land-derived nutrients into algal biomass.
Conflict of interest statement
The authors declare no conflict of interest.
Figures
References
-
- Cloern JE. Mar Ecol Prog Ser. 2001;210:223–253.
-
- Nichols FH, Cloern JE, Luoma SN, Peterson DH. Science. 1986;231:567–573. - PubMed
-
- Cloern JE. Rev Geophys. 1996;34:127–168.
-
- Cloern JE, Schraga TS, Lopez CB, Knowles N, Labiosa RG, Dugdale R. Geophys Res Lett. 2005;32:LI4608.
-
- Smith SV, Hollibaugh JT. Limnol Oceanogr. 2006;51:504–517.
Publication types
MeSH terms
Substances
LinkOut - more resources
Full Text Sources
Other Literature Sources
Molecular Biology Databases
