. 2007 Nov 20;104(47):18772-7.
doi: 10.1073/pnas.0705546104. Epub 2007 Nov 13.

Natural stimuli evoke dynamic sequences of states in sensory cortical ensembles

Affiliations

Natural stimuli evoke dynamic sequences of states in sensory cortical ensembles

Lauren M Jones et al. Proc Natl Acad Sci U S A. .

Abstract

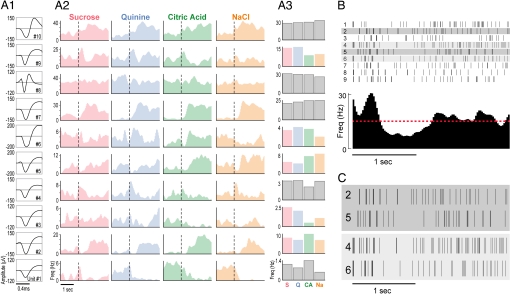
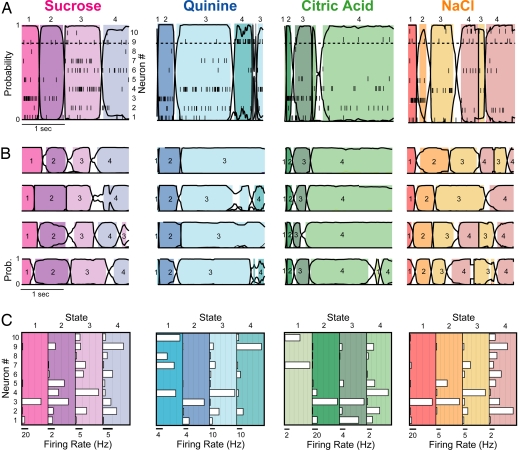
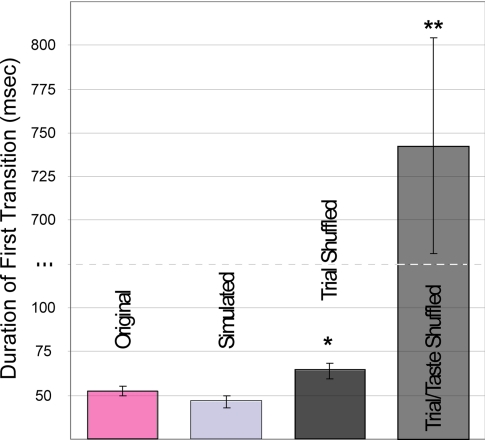
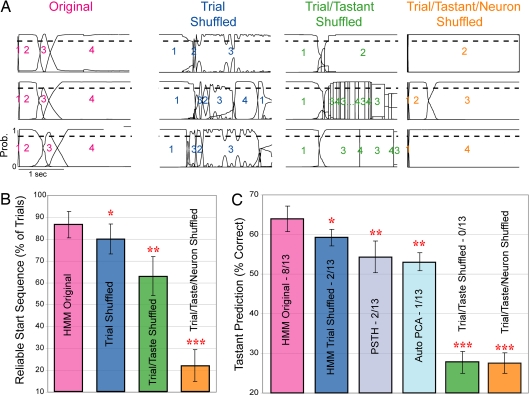
Although temporal coding is a frequent topic of neurophysiology research, trial-to-trial variability in temporal codes is typically dismissed as noise and thought to play no role in sensory function. Here, we show that much of this supposed "noise" faithfully reflects stimulus-related processes carried out in coherent neural networks. Cortical neurons responded to sensory stimuli by progressing through sequences of states, identifiable only in examinations of simultaneously recorded ensembles. The specific times at which ensembles transitioned from state to state varied from trial to trial, but the state sequences were reliable and stimulus-specific. Thus, the characterization of ensemble responses in terms of state sequences captured facets of sensory processing that are missing from, and obscured in, other analyses. This work provides evidence that sensory neurons act as parts of a systems-level dynamic process, the nature of which can best be appreciated through observation of distributed ensembles.


Conflict of interest statement

The authors declare no conflict of interest.

Figures

Fig. 1.
Fig. 1.
Taste responses in GC neurons. (A1) Waveforms representing the average action potential shapes for the 10 neurons (each numbered in bottom right) of one simultaneously recorded ensemble; x axis, time; y axis, amplitude (μV). (A2) PSTHs of the response of each neuron to the four basic taste stimuli (top); x axis, time; y axis, firing rate (Hz); dashed vertical line, stimulus onset. (A3) Responses of each neuron to the four tastes, averaged across trials and across 2.5 sec of poststimulus time; color panels are taste-specific by classic analysis (28). (B) (Upper) Raster plots of a neuron response on individual trials (rows). Each tick mark is an action potential. (Lower) Resultant PSTH; the red dashed line indicates the spontaneous firing rate. (C) Two pairs of trials from B, each matched for number of action potentials.
Fig. 2.
Fig. 2.
Coherent state sequences in GC ensembles. (A) Representative single trials of the response of one GC ensemble to each basic taste stimulus (top) reveal simultaneous changes in firing rates in several neurons. Overlaying the population raster plots (each tick mark is an action potential, and each row is a different simultaneously recorded neuron; right y axis) is the HMM output: black continuous lines show the likelihood (left y axis) of each state through time (x axis), and shaded regions are periods during which one particular state (each shade represents specific states, numbered above the panel) exceeds 0.8 likelihood (horizontal dashed line). In nonshaded periods, no state was dominant. (B) Four more trials of the response of the same ensemble to each taste, showing reliability of state sequence and trial-to-trial variability of transition time. Numbers within each colored region label the state number. (C) Histograms showing firing rates of each neuron (open horizontal bars) in each state for each taste. Each box summarizes the states for the above taste, and each shaded panel within each box corresponds to a state (color-coded as above); the number of the state is listed above. [Scale bars (below each shaded panel): spikes per sec; y axis, neuron (numbered from 1 to 10).]
Fig. 3.
Fig. 3.
State transitions are rapid in simultaneously recorded neural ensembles. The average duration of transitions between states (±SEM) for the real data (pink bar) was equivalent to that for simulated data with instantaneously changing underlying states (light gray bar) and faster than that for both trial-shuffled (dark gray bar) and trial/taste-shuffled (medium gray bar) data. *, P < 0.05; **, P < 0.001.
Fig. 4.
Fig. 4.
State sequences predict sensory stimuli better than other techniques. (A) State sequences were more consistent for original (unshuffled) trials than after trial-shuffling, trial/taste-shuffling, or trial/taste/neuron-shuffling. Shown are three representative trials per dataset; as in Fig. 2, continuous lines represent the probability of a specific state (y axis), numbers label the dominant states, and the dashed line is 0.8 probability. (B) Across ensembles, the percentage of trials beginning with the same three-state sequence (y axis) is higher for the original data (pink bar) than for trial-shuffled (blue bar), trial/taste-shuffled (green bar), or trial/taste/neuron-shuffled data (orange bar). (C) The percentage of trials in which the taste was correctly predicted is higher for the original data (pink bar) than for trial-shuffled (dark blue bar), trial/taste-shuffled (green bar), or trial/taste/neuron-shuffled data (orange bar). HMM also performed better than ensembles of PSTHs (gray bar) and better than PCA (light blue bar). *, P < 0.05; **, P < 0.01; ***, P < 0.001, all paired t tests.

References

    1. Richmond BJ, Optican LM, Spitzer H. J Neurophysiol. 1990;64:351–369. - PubMed
    1. Jones LM, Depireux DA, Simons DJ, Keller A. Science. 2004;304:1986–1989. - PMC - PubMed
    1. Fdez Galan R, Sachse S, Galizia CG, Herz AV. Neural Comput. 2004;16:999–1012. - PubMed
    1. Wehr M, Laurent G. Nature. 1996;384:162–166. - PubMed
    1. Gourevitch B, Eggermont JJ. J Neurophysiol. 2007;97:144–158. - PubMed

Publication types