Meta-Analysis
. 2007 Nov 14:5:32.
doi: 10.1186/1741-7015-5-32.

A meta-analysis of N-acetylcysteine in contrast-induced nephrotoxicity: unsupervised clustering to resolve heterogeneity

Affiliations
Meta-Analysis

A meta-analysis of N-acetylcysteine in contrast-induced nephrotoxicity: unsupervised clustering to resolve heterogeneity

Denise A Gonzales et al. BMC Med. .

Abstract

Background: Meta-analyses of N-acetylcysteine (NAC) for preventing contrast-induced nephrotoxicity (CIN) have led to disparate conclusions. Here we examine and attempt to resolve the heterogeneity evident among these trials.

Methods: Two reviewers independently extracted and graded the data. Limiting studies to randomized, controlled trials with adequate outcome data yielded 22 reports with 2746 patients.

Results: Significant heterogeneity was detected among these trials (I2 = 37%; p = 0.04). Meta-regression analysis failed to identify significant sources of heterogeneity. A modified L'Abbé plot that substituted groupwise changes in serum creatinine for nephrotoxicity rates, followed by model-based, unsupervised clustering resolved trials into two distinct, significantly different (p < 0.0001) and homogeneous populations (I2 = 0 and p > 0.5, for both). Cluster 1 studies (n = 18; 2445 patients) showed no benefit (relative risk (RR) = 0.87; 95% confidence interval (CI) 0.68-1.12, p = 0.28), while cluster 2 studies (n = 4; 301 patients) indicated that NAC was highly beneficial (RR = 0.15; 95% CI 0.07-0.33, p < 0.0001). Benefit in cluster 2 was unexpectedly associated with NAC-induced decreases in creatinine from baseline (p = 0.07). Cluster 2 studies were relatively early, small and of lower quality compared with cluster 1 studies (p = 0.01 for the three factors combined). Dialysis use across all studies (five control, eight treatment; p = 0.42) did not suggest that NAC is beneficial.

Conclusion: This meta-analysis does not support the efficacy of NAC to prevent CIN.


Figures

Figure 1
Figure 1
Study selection flow diagram.
Figure 2
Figure 2
Forest plot of twenty-two studies meeting inclusion criteria for meta-analysis. Studies are ordered by date of publication. Lines represent 95% CIs. Box sizes represent the weight (by inverse variance) of each trial. Note a trend over time towards no effect. No summary statistic is shown owing to excessive heterogeneity.
Figure 3
Figure 3
Funnel plot of precision versus log RR. Log RR of developing CIN is plotted versus precision for each of the 22 studies in this meta-analysis. Four studies later identified as contributing most to heterogeneity are noted with open circles and are seen to produce asymmetry in the plot. The summary log RR for all 22 studies is denoted by the open diamond.
Figure 4
Figure 4
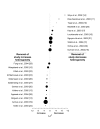
Jackknife sensitivity analysis. Studies are ordered from top to bottom by their effect on heterogeneity when removed one at a time from the set of 22 studies. Removing any of the 10 studies at the top of the plot decreases heterogeneity, while removing any of the 12 studies at the bottom of the plot increases heterogeneity. The four studies that individually contributed the most to heterogeneity are shown as open circles. Circle size is proportional to the inverse variance.
Figure 5
Figure 5
Changes in creatinine across all trials. A: Modified L'Abbé plot of change in creatinine from baseline to study endpoint in the control arm (x-axis) versus NAC treatment arm (y-axis) of each study. Studies are weighted by inverse variance (i.e. larger symbols represent larger studies with less variability). Open circles denote cluster 2 studies [10, 11, 14, 25]. B: Box plot of change in creatinine from baseline to study endpoint in the control arm and NAC treatment arm of each study. Boxes represent the 25th, 50th and 75th percentiles. Whiskers are 5th and 95th percentiles. Dashed lines show the mean of each group. Open squares denote cluster 2 studies.
Figure 6
Figure 6
Cluster analysis based on changes in creatinine. A: Modified L'Abbé plot showing the results of model-based, unsupervised cluster analysis. Unlike Figure 5A, studies are unweighted for easier visualization. Cluster analysis (see the Methods section) applied to the 22 studies found two distinct populations of trials. Crosshairs and circles denote the mean ± SD of each cluster. B: Aggregate NAC treatment effect and heterogeneity analysis of each cluster. The entire group of 22 studies had unacceptable heterogeneity (I2 = 37%; p = 0.04) making the summary point estimate unreliable (not shown). Cluster 1 (n = 18; 2445 patients) is homogeneous and shows no benefit (RR = 0.87; 95% CI 0.68–1.12, p = 0.28). Cluster 2 (N = 4; 301 patients) is also homogeneous and indicates that NAC is very beneficial (RR = 0.15; 95% CI 0.07–0.33, p < 0.0001).
Figure 7
Figure 7
Hemodialysis risk model. Relative risk of developing CIN is plotted versus RR of needing hemodialysis, based on hemodialysis data available from nine studies. Axes are in logarithmic scale. The RR of CIN would have to be less than 0.67 in order for the RR of hemodialysis not to be on the side of harm (RR < 1).

References

    1. Smith GD, Egger M. Meta-analysis: unresolved issues and future developments. Br Med J. 1998;316:221–225. - PMC - PubMed
    1. Moher D, Cook DJ, Eastwood S, Olkin I, Rennie D, Stroup DF. Improving the quality of reports of meta-analyses of randomised controlled trials: the QUOROM statement. Quality of reporting of meta-analyses. Lancet. 1999;354:1896–1900. doi: 10.1016/S0140-6736(99)04149-5. - DOI - PubMed
    1. Noble JH., Jr Meta-analysis: methods, strengths, weaknesses, and political uses. J Lab Clin Med. 2006;147:7–20. doi: 10.1016/j.lab.2005.08.006. - DOI - PubMed
    1. Higgins JP, Thompson SG. Quantifying heterogeneity in a meta-analysis. Stat Med. 2002;21:1539–1558. doi: 10.1002/sim.1186. - DOI - PubMed
    1. Egger M, Davey Smith G, Schneider M, Minder C. Bias in meta-analysis detected by a simple, graphical test. Br Med J. 1997;315:629–634. - PMC - PubMed

Publication types