Comparative Study
. 2007 Dec;11(4):301-15.
doi: 10.1177/1084713807305301.

Vocal emotion recognition by normal-hearing listeners and cochlear implant users

Affiliations
Comparative Study

Vocal emotion recognition by normal-hearing listeners and cochlear implant users

Xin Luo et al. Trends Amplif. 2007 Dec.

Erratum in

  • Trends Amplif. 2007 Sep;11(3):e1

Abstract

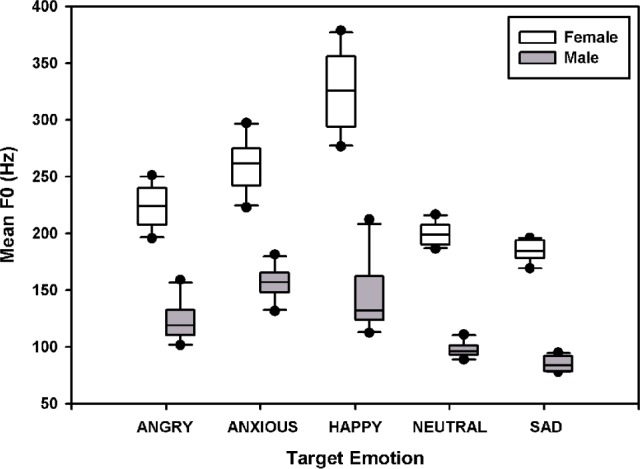
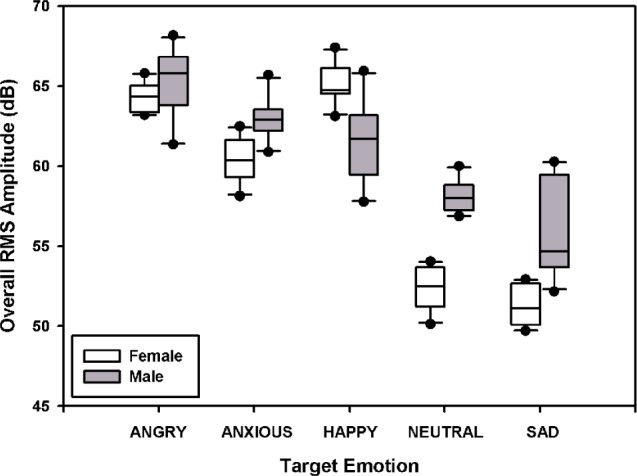
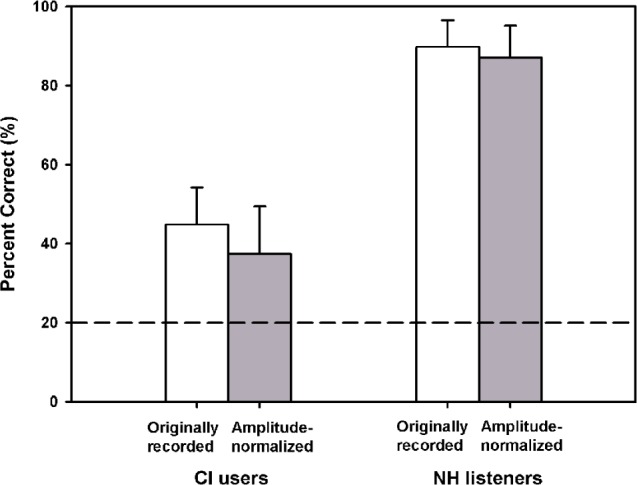
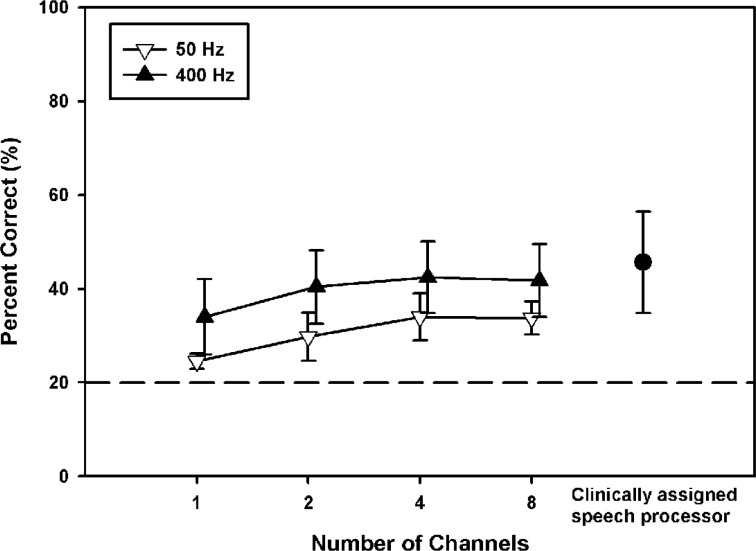
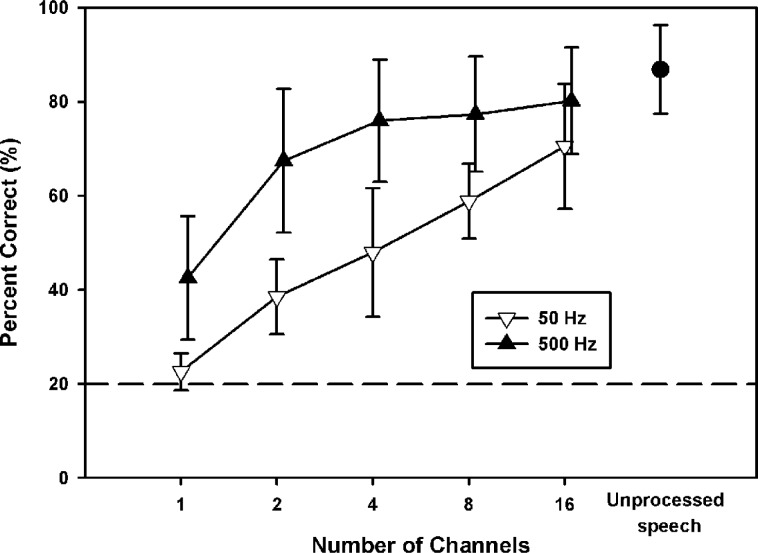
The present study investigated the ability of normal-hearing listeners and cochlear implant users to recognize vocal emotions. Sentences were produced by 1 male and 1 female talker according to 5 target emotions: angry, anxious, happy, sad, and neutral. Overall amplitude differences between the stimuli were either preserved or normalized. In experiment 1, vocal emotion recognition was measured in normal-hearing and cochlear implant listeners; cochlear implant subjects were tested using their clinically assigned processors. When overall amplitude cues were preserved, normal-hearing listeners achieved near-perfect performance, whereas listeners with cochlear implant recognized less than half of the target emotions. Removing the overall amplitude cues significantly worsened mean normal-hearing and cochlear implant performance. In experiment 2, vocal emotion recognition was measured in listeners with cochlear implant as a function of the number of channels (from 1 to 8) and envelope filter cutoff frequency (50 vs 400 Hz) in experimental speech processors. In experiment 3, vocal emotion recognition was measured in normal-hearing listeners as a function of the number of channels (from 1 to 16) and envelope filter cutoff frequency (50 vs 500 Hz) in acoustic cochlear implant simulations. Results from experiments 2 and 3 showed that both cochlear implant and normal-hearing performance significantly improved as the number of channels or the envelope filter cutoff frequency was increased. The results suggest that spectral, temporal, and overall amplitude cues each contribute to vocal emotion recognition. The poorer cochlear implant performance is most likely attributable to the lack of salient pitch cues and the limited functional spectral resolution.


Figures

Figure 1.
Figure 1.
Mean F0 values of test sentences for the 5 target emotions. The white boxes show the data for the female talker, and the gray boxes show the data for the male talker. The lines within the boxes indicate the median; the upper and lower boundaries of the boxes indicate the 75th and 25th percentiles. The error bars above and below the boxes indicate the 90th and 10th percentiles. The symbols show the outlying data.
Figure 2.
Figure 2.
Range of F0 variation of test sentences for the 5 target emotions. The white boxes show the data for the female talker, and the gray boxes show the data for the male talker. The lines within the boxes indicate the median; the upper and lower boundaries of the boxes indicate the 75th and 25th percentiles. The error bars above and below the boxes indicate the 90th and 10th percentiles. The symbols show the outlying data.
Figure 3.
Figure 3.
Mean F1 values of test sentences for the 5 target emotions. The white boxes show the data for the female talker, and the gray boxes show the data for the male talker. The lines within the boxes indicate the median; the upper and lower boundaries of the boxes indicate the 75th and 25th percentiles. The error bars above and below the boxes indicate the 90th and 10th percentiles. The symbols show the outlying data.
Figure 4.
Figure 4.
Overall root mean square (RMS) amplitudes of test sentences for the 5 target emotions. The white boxes show the data for the female talker, and the gray boxes show the data for the male talker. The lines within the boxes indicate the median; the upper and lower boundaries of the boxes indicate the 75th and 25th percentiles. The error bars above and below the boxes indicate the 90th and 10th percentiles. The symbols show the outlying data.
Figure 5.
Figure 5.
Overall duration of test sentences for the 5 target emotions. The white boxes show the data for the female talker, and the gray boxes show the data for the male talker. The lines within the boxes indicate the median; the upper and lower boundaries of the boxes indicate the 75th and 25th percentiles. The error bars above and below the boxes indicate the 90th and 10th percentiles. The symbols show the outlying data.
Figure 6.
Figure 6.
Mean vocal emotion recognition scores (averaged across subjects) for normal-hearing (NH) listeners and for cochlear implant (CI) subjects using their clinically assigned speech processors, obtained with originally recorded (white bars) and amplitude-normalized speech (gray bars). The error bars represent 1 SD. The dashed horizontal line indicates chance performance level (ie, 20% correct).
Figure 7.
Figure 7.
Mean vocal emotion recognition scores for 4 cochlear implant subjects listening to amplitude-normalized speech via experimental processors, as a function of the number of channels. The open downward triangles show data with the 50-Hz temporal envelope filter, and the filled upward triangles show data with the 400-Hz temporal envelope filter. The filled circle shows mean performance for the 4 cochlear implant subjects listening to amplitude-normalized speech via clinically assigned speech processors (experiment 1). The error bars represent 1 SD. The dashed horizontal line indicates chance performance level (ie, 20% correct).
Figure 8.
Figure 8.
Mean vocal emotion recognition scores for 6 normal-hearing subjects listening to amplitude-normalized speech via acoustic CI simulations, as a function of the number of channels. The open downward triangles show data with the 50-Hz temporal envelope filter, and the filled upward triangles show data with the 500-Hz temporal envelope filter. The filled circle shows mean performance for the 6 normal-hearing subjects listening to unprocessed amplitude-normalized speech (experiment 1). The error bars represent 1 SD. The dashed horizontal line indicates chance performance level (ie, 20% correct).

References

    1. Fu QJ, Shannon RV, Wang X. Effects of noise and spectral resolution on vowel and consonant recognition: acoustic and electric hearing. J Acoust Soc Am. 1998;104: 3586–3596 - PubMed
    1. Friesen LM, Shannon RV, Baskent D, Wang X. Speech recognitioninnoiseasafunctionofthenumberofspectral channels: comparison of acoustic hearing and cochlear implants. J Acoust Soc Am. 2001;110: 1150–1163 - PubMed
    1. Fu QJ, Nogaki G. Noise susceptibility of cochlear implant users: the role of spectral resolution and smearing. J Assoc Res Otolaryngol. 2005;6: 19–27 - PMC - PubMed
    1. Fu QJ, Chinchilla S, Galvin JJ., III The role of spectral and temporal cues in voice gender discrimination by normal-hearing listeners and cochlear implant users. J Assoc Res Otolaryngol. 2004;5: 253–260 - PMC - PubMed
    1. Fu QJ, Chinchilla S, Nogaki G, Galvin JJ., III Voice gender identification by cochlear implant users: the role of spectral and temporal resolution. J Acoust Soc Am. 2005;118: 1711–1718 - PubMed

Publication types