. 2007 Nov 20;104(47):18461-6.
doi: 10.1073/pnas.0707647104. Epub 2007 Nov 14.

Mapping hydration dynamics around a protein surface

Affiliations

Mapping hydration dynamics around a protein surface

Luyuan Zhang et al. Proc Natl Acad Sci U S A. .

Abstract

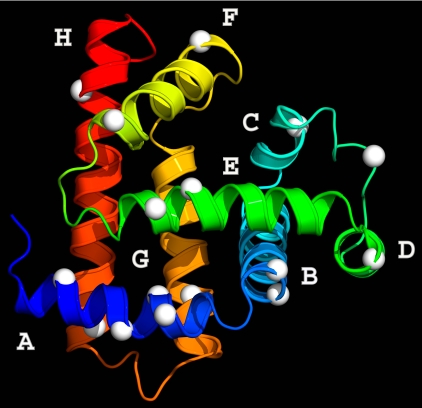
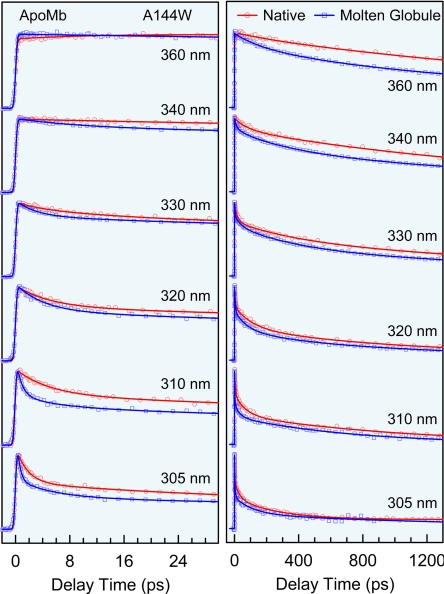
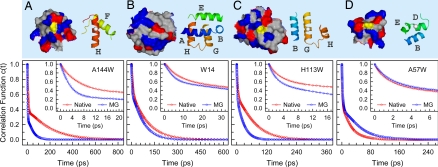
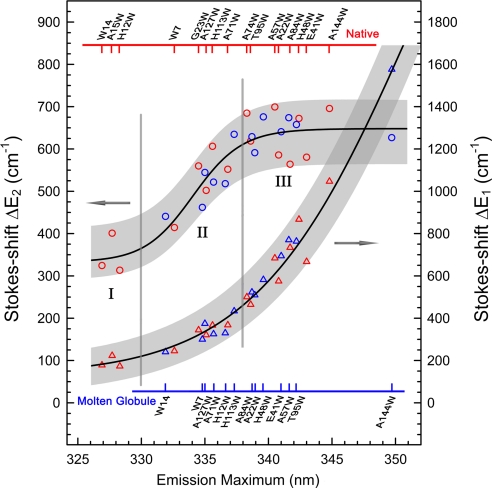
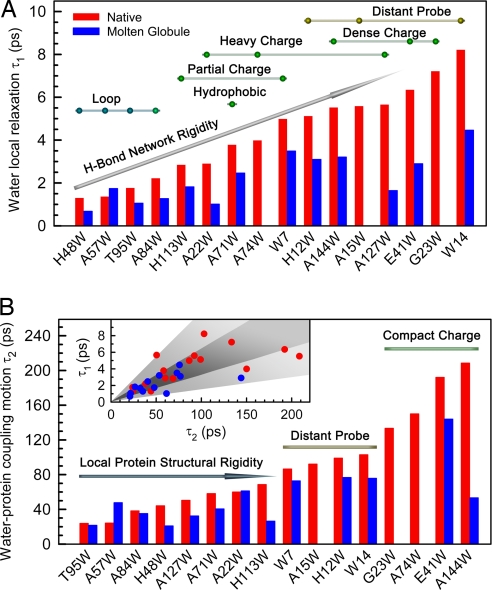
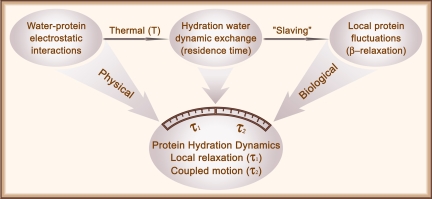
Protein surface hydration is fundamental to its structure and activity. We report here the direct mapping of global hydration dynamics around a protein in its native and molten globular states, using a tryptophan scan by site-specific mutations. With 16 tryptophan mutants and in 29 different positions and states, we observed two robust, distinct water dynamics in the hydration layer on a few ( approximately 1-8 ps) and tens to hundreds of picoseconds ( approximately 20-200 ps), representing the initial local relaxation and subsequent collective network restructuring, respectively. Both time scales are strongly correlated with protein's structural and chemical properties. These results reveal the intimate relationship between hydration dynamics and protein fluctuations and such biologically relevant water-protein interactions fluctuate on picosecond time scales.


Conflict of interest statement

The authors declare no conflict of interest.

Figures

Fig. 1.
Fig. 1.
Global mapping of surface hydration dynamics of apoMb. Shown is the x-ray crystal structure of sperm whale myoglobin (Protein Data Bank ID code 1MBD) in the holo form with eight helices A–H colored from blue to red. The 16 white balls indicate positions of mutation with tryptophan one at a time. In the apo form, the F-helix melts to a random coil (33).
Fig. 2.
Fig. 2.
Femtosecond-resolved fluorescence transients of mutant A144W for several gated emission wavelengths in the native (red) and molten globule (blue) states in short (Left) and long (Right) time ranges. The circles and squares are the experimental data, and the solid lines are the best multiple-exponential fit. The transients display a typical pattern of solvation dynamics: fast decay at the shorter wavelengths and initial rise at the longer wavelengths. Note that all of the signals become faster in the molten globule state.
Fig. 3.
Fig. 3.
Local protein properties and solvation correlation functions of four representative mutants. (Upper) Native-state surface maps (Left) and secondary structures (Right) within ≈12 Å around tryptophan. On the surface maps, blue, red, and gray colors represent positively charged, negatively charged, and nonpolar amino acids, respectively, and tryptophans are in yellow. In the secondary structures, the color of each helix corresponds to that in Fig. 1, and tryptophan is shown as a white ball. (Lower) Solvation correlation functions of the four mutants in the native (red) and molten globule (MG; blue) states. The circles are the experimental data, and the solid lines are the best double-exponential fit. (A) A144W on the dense charge surface of H-helix. (B) W14 on A-helix but buried inside the protein. (C) H113W on G-helix with a more rigid local structure in the native state. (D) A57W on D-helix in a less structured region at the native state.
Fig. 4.
Fig. 4.
The two dynamic Stokes shifts ΔE1 (triangles; right y axis) and ΔE2 (circles; left y axis) of all mutants in the native (red) and molten globule (blue) states plotted against their steady-state fluorescence emission peaks. The black lines show the increasing trends, and the shades cover the fluctuation ranges of the two energies. Mutants' names are given on the top for the native and at the bottom for the molten globule with ticks corresponding to the data points. The three regions (I–III) represent tryptophan positions relative to the protein surface (see text).
Fig. 5.
Fig. 5.
The hydration dynamics, τ1 (A) and τ2 (B), of all mutants plotted according to the order of their time scales in the native state. (A) The beads above the bars represent the native-state mutants and are classified according to their probe positions (yellow), local charge distributions (green), and local secondary structures (blue). The water motion correlates with local charge distributions, protein structural properties, and probe locations. (B) The native-state mutants are simply grouped by two bars, dense charge surfaces and distant probe, and an arrow with the increased structural rigidity, colored with the same code for the beads in A. B Inset also shows the correlation of two hydration dynamics.
Fig. 6.
Fig. 6.
Schematic representation of the mechanism of protein surface hydration. The fundamental electrostatic interaction between water and protein is the key for hydration layer formation. Under thermal fluctuation, the hydration layer water is in dynamic exchange with bulk water (residence time). Such water fluctuations in and out control local protein motions (35, 36). The hydration dynamics reported here represent two types of collective water fluctuations inside the layer: initial fundamental physical motion of libration and rotation and subsequent network restructuring coupled with slaved protein motions, a dynamic process of biologically relevant water–protein interactions.

References

    1. Pal SK, Zewail AH. Chem Rev. 2004;104:2099–2123. - PubMed
    1. Wüthrich K. Angew Chem Int Ed. 2003;42:3340–3363. - PubMed
    1. Levy Y, Onuchic JN. Annu Rev Biophys Biomol Struct. 2006;35:389–415. - PubMed
    1. Mattos C. Trends Biochem Sci. 2002;27:203–208. - PubMed
    1. Garczarek F, Gerwert K. Nature. 2006;439:109–112. - PubMed

Publication types