. 2007 Nov 20;104(47):18654-9.
doi: 10.1073/pnas.0704652104. Epub 2007 Nov 14.

Integrated genetic and epigenetic analysis identifies three different subclasses of colon cancer

Affiliations

Integrated genetic and epigenetic analysis identifies three different subclasses of colon cancer

Lanlan Shen et al. Proc Natl Acad Sci U S A. .

Abstract

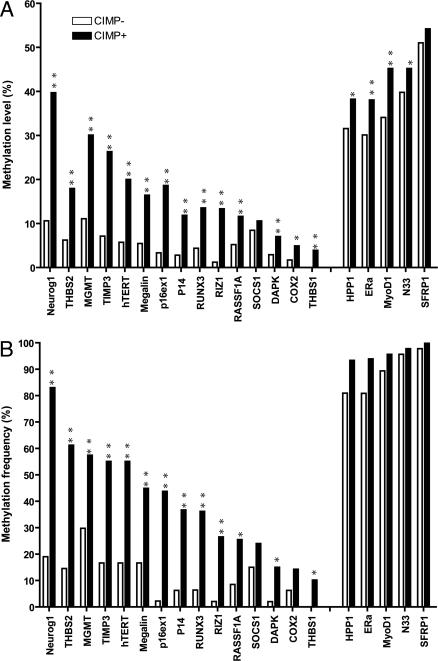
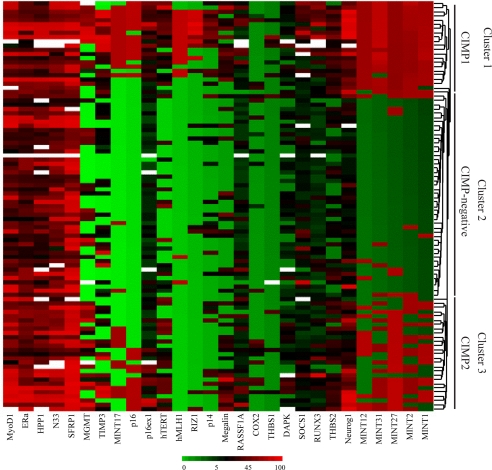
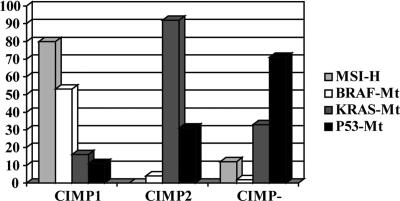
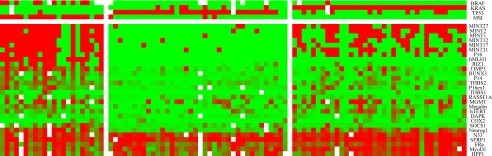
Colon cancer has been viewed as the result of progressive accumulation of genetic and epigenetic abnormalities. However, this view does not fully reflect the molecular heterogeneity of the disease. We have analyzed both genetic (mutations of BRAF, KRAS, and p53 and microsatellite instability) and epigenetic alterations (DNA methylation of 27 CpG island promoter regions) in 97 primary colorectal cancer patients. Two clustering analyses on the basis of either epigenetic profiling or a combination of genetic and epigenetic profiling were performed to identify subclasses with distinct molecular signatures. Unsupervised hierarchical clustering of the DNA methylation data identified three distinct groups of colon cancers named CpG island methylator phenotype (CIMP) 1, CIMP2, and CIMP negative. Genetically, these three groups correspond to very distinct profiles. CIMP1 are characterized by MSI (80%) and BRAF mutations (53%) and rare KRAS and p53 mutations (16% and 11%, respectively). CIMP2 is associated with 92% KRAS mutations and rare MSI, BRAF, or p53 mutations (0, 4, and 31% respectively). CIMP-negative cases have a high rate of p53 mutations (71%) and lower rates of MSI (12%) or mutations of BRAF (2%) or KRAS (33%). Clustering based on both genetic and epigenetic parameters also identifies three distinct (and homogeneous) groups that largely overlap with the previous classification. The three groups are independent of age, gender, or stage, but CIMP1 and 2 are more common in proximal tumors. Together, our integrated genetic and epigenetic analysis reveals that colon cancers correspond to three molecularly distinct subclasses of disease.


Conflict of interest statement

The authors declare no conflict of interest.

Figures

Fig. 1.
Fig. 1.
Comparison of methylation level and frequency for 20 genes between CIMP-positive and negative groups. (A) Comparison of the mean methylation level of each gene between CIMP-positive group and CIMP-negative group. All genes except SFRP1 and SOCS1 showed significantly higher methylation level in the CIMP-positive group. (B) Comparison of methylation frequency of positive cases for each gene between CIMP-positive and -negative groups. Methylation-positive case is defined by methylation level >15%. All Type-C genes except SOCS1 showed significantly higher frequency of methylation in CIMP-positive group, whereas 5 Type-A genes (on the Right) showed no difference between these two groups. **, P < 0.001; *, P < 0.05
Fig. 2.
Fig. 2.
Unsupervised hierarchical clustering analysis on the basis of 27 methylation markers. Three separate clusters were generated by this analysis with one cluster corresponding very closely to the previous CIMP-negative group (middle cluster), and CIMP-positive cases were separated into two subgroups, CIMP1 (cluster 1) and CIMP 2 (cluster 3).
Fig. 3.
Fig. 3.
Comparison of the genetic alterations among the three clusters. Each cluster corresponds to very distinct genetic profiles. CIMP1 is characterized by high frequency of MSI (80%) and BRAF mutations (53%), CIMP2 is characterized by a higher rate of KRAS mutations (92%), and CIMP negative is characterized by high frequency of p53 mutations (71%).
Fig. 4.
Fig. 4.
K-means clustering analysis on the basis of both genetic and epigenetic markers. K-means clustering including genetic information yielded very homogenous groups. Twenty-two cases were classified as CIMP1 (23%), 37 cases (38%) were classified as CIMP2, and 38 cases (39%) were classified as CIMP negative. This clustering largely overlaps with the previous hierarchical clustering with only 17 cases (18%) reclassified.
Fig. 5.
Fig. 5.
Comparison of methylation for Type-C genes and Type-A genes among the three clusters. A Z-score method was used to standardize the methylation level of each gene and each patient was assigned methylation scores based on the average Z-scores of either Type-C genes or Type-A genes. (Left) For Type-C genes, the average methylation Z-score was significantly higher in CIMP1 compared with other two groups (P < 0.001). (Right) For Type-A genes, the average methylation Z-score was significantly higher in CIMP2 group (P = 0.04).

References

    1. Jemal A, Murray T, Ward E, Samuels A, Tiwari RC, Ghafoor A, Feuer EJ, Thun MJ. CA Cancer J Clin. 2005;55:10–30. - PubMed
    1. Kinzler KW, Vogelstein B. Cell. 1996;87:159–170. - PubMed
    1. Jones PA, Baylin SB. Nat Rev Genet. 2002;3:415–428. - PubMed
    1. Bock C, Walter J, Paulsen M, Lengauer T. PLoS Comput Biol. 2007;3:e110. - PMC - PubMed
    1. Jones PA, Takai D. Science. 2001;293:1068–1070. - PubMed

Publication types

Substances