. 2008 Feb;19(2):536-45.
doi: 10.1091/mbc.e07-08-0818. Epub 2007 Nov 14.

Adducin promotes micrometer-scale organization of beta2-spectrin in lateral membranes of bronchial epithelial cells

Affiliations

Adducin promotes micrometer-scale organization of beta2-spectrin in lateral membranes of bronchial epithelial cells

Khadar M Abdi et al. Mol Biol Cell. 2008 Feb.

Abstract

Adducin promotes assembly of spectrin-actin complexes, and is a target for regulation by calmodulin, protein kinase C, and rho kinase. We demonstrate here that adducin is required to stabilize preformed lateral membranes of human bronchial epithelial (HBE) cells through interaction with beta2-spectrin. We use a Tet-on regulated inducible small interfering RNA (siRNA) system to deplete alpha-adducin from confluent HBE cells. Depletion of alpha-adducin resulted in increased detergent solubility of spectrin after normal membrane biogenesis during mitosis. Conversely, depletion of beta2-spectrin resulted in loss of adducin from the lateral membrane. siRNA-resistant alpha-adducin prevented loss of lateral membrane, but only if alpha-adducin retained the MARCKS domain that mediates spectrin-actin interactions. Phospho-mimetic versions of adducin with S/D substitutions at protein kinase C phosphorylation sites in the MARCKS domain were not active in rescue. We find that adducin modulates long-range organization of the lateral membrane based on several criteria. First, the lateral membrane of adducin-depleted cells exhibited reduced height, increased curvature, and expansion into the basal surface. Moreover, E-cadherin-GFP, which normally is restricted in lateral mobility, rapidly diffuses over distances up to 10 microm. We conclude that adducin acting through spectrin provides a novel mechanism to regulate global properties of the lateral membrane of bronchial epithelial cells.


Figures
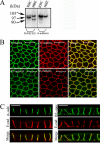
Figure 1.
Figure 1.
HBE cells express α and γ forms of adducin. (A) Affinity-purified anti-MARCKS and anti-α-adducin antibodies were used to blot lysates from red blood cell ghosts (RBC) and HBE cells. Anti-MARCKS antibody recognizes α (105 kDa) and β (97 kDa) in RBCs and recognizes α (105 kDa) and γ (90 kDa) in HBE cells. The affinity-purified rabbit anti-α-adducin antibody recognizes a single polypeptide with Mr 105 kDa in both RBCs and HBE cells. (B) Immunofluorescence staining of HBE cells reveals α-adducin and β2-spectrin both colocalize with E-cadherin in HBE cells. Scale bars, 20 μm. (C) Confocal slices taken of the XZ axis reveal extensive colocalization of α-adducin and β2-spectrin, with E-cadherin along the lateral membrane. Scale bars, 10 μm.
Figure 2.
Figure 2.
Adducin is required to maintain lateral membrane height. (A) Confluent monolayers of HBEADD1 were allowed to form lateral membranes then induced to express the ADD1 shRNA using 100 ng/ml doxycycline for the indicated lengths of time. Cell extracts were collected from each time point and blotted using rabbit antibodies: anti-α-adducin, anti-β2-spectrin; mouse antibodies: anti-E-cadherin. (B) HBEADD1 cells were fixed at 0-, 24-, 48-, and 72-h time points after doxycycline treatment and costained using anti-α-adducin (red) and anti-E-cadherin (green), revealing changes in cross-sectional surface area. (C) Lateral membrane height and surface area were measured using LSM510 software on images collect from 25 fields for each time point and then correlated with α-adducin levels. Differences in cell height and surface area were confirmed to be statistically significant using Student's t tests; n > 50 for control and knockdown cells. (D) The single time point of 72 h was used to collect XZ confocal slices from HBEADD1 or HBECTL cells. HBECTL were stained with mouse gp135 antibody (green), and tight junctions were stained through mouse anti-Z0-1 (green). DNA is stained in blue, whereas adducin is stained in red. HBEADD1 cells also maintain tight junctions and apical polarity. Scale bars, 20 μm.
Figure 3.
Figure 3.
Biogenesis of the lateral membrane after cytokinesis proceeds in the absence of α-adducin. Cells were treated with 100 ng/ml doxycycline for 72 h then fixed and stained with α-tubulin (green) and β-catenin (red). Left panel represents collapsed Z-series collected at 0.3-μm intervals, whereas right panel shows XZ section taken at 0.05-μm intervals with the addition of staining for α-adducin to show level of depletion. Arrow depicts the forming lateral membrane as marked by β-catenin. Scale bars, (XY) 20 μm; (XZ) 5 μm.
Figure 4.
Figure 4.
β2-spectrin is required for accumulation of adducin at the lateral membrane. (Top row) Staining of β2-spectrin after transfection with control (pSuper plasmid) or β2-spectrin shRNA plasmids. (Bottom row) Staining of α-adducin after transfection with control or β2-spectrin shRNA plasmids. Asterisks show sites of cell–cell contact where α-adducin staining is eliminated. Scale bars, 20 μm.
Figure 5.
Figure 5.
The MARCKS domain of α-adducin is required for lateral membrane targeting and rescue of lateral membranes upon endogenous α-adducin depletion. (A) Diagram depicting domain organization for α-adducin, with the core domain at the N-terminal half (a.a. 1-365) followed by the neck (a.a. 351-500) and tail domain (a.a. 500-711) and ending with the MARCKS-domain (a.a. 711-737). Two lysines that are predicted to be required for β2-spectrin interactions are underlined, and the PKC sites are highlighted in red. (B) HBE cells were transfected with shRNA resistant HA-α-adducin constructs with the displayed amino acid substitutions and stained using a monoclonal HA antibody. Scale bars equal 20 μm. (C) HBECTL or HBEADD1 cells were transfected at 70% confluence with HA-α-adducin WT cDNA, containing nucleotide substitutions at nucleotides 581-584 conferring shRNA resistance. After 24 h after transfection cells were treated with 100 ng/ml doxycycline for 72 h, then fixed and stained with monoclonal HA antibody (green) and rabbit ankyrin-G antibody (red). Images were taken along the XZ axis to measure lateral membrane height. Arrow head points to lateral membrane of an untransfected cell; arrow points to an HA-α-adducin WT transfected cell. HA-α-adducin 1-711 cDNA lacks the MARCKS domain sequence, whereas HA-α-adducin KK718AA contains amino acids substitution of two lysines at positions 718 and 719 to alanines. HA-α-adducin S716D/S726D contains substitution of serines 716 and 726, representing the major PKC sites, to aspartic acid. Scale bars, 10 μm. (D) Only full-length WT HA-α-adducin cDNA can rescue the lateral membrane from ∼3.5 to ∼7 μm upon depletion of endogenous α-adducin. Error bars, SEM; n ≥ 12 for each constuct.
Figure 6.
Figure 6.
Increased solubility of β2-spectrin in Triton X-100 in α-adducin–depleted HBE cells. (A) HBECTL and HBEADD1 cells were seeded to confluence, treated with 100 ng/ml doxycycline for 72 h and then extracted with 0.2% Triton X-100 for 10 min at room temperature. Cells were fixed and stained for β2-spectrin; untreated (left panel), Triton X-100 treated (right panel). Confocal XY sections were taken from different fields and revealed similar reduction of β2-spectrin levels after extraction in HBEADD1 cells. Diagonal white line represents regions of interests used to measure fluorescence intensities. (B) Line graph of representative level of fluorescence intensity between control (blue, top) and adducin depleted (red, bottom) cells taken from LSM imager software. F.I., fluorescence intensity, a.u., arbitrary units. (C) Cells were extracted as above but in the presence of protease inhibitors separating soluble and insoluble fractions. Samples were loaded in 5× PAGE buffer and blotted for β2-spectrin. (D) Fluorescence was measured using LSM imaging software. Quantitation of immunofluorescence was performed by measuring lateral membrane intensities of 10 regions of interests from each field of cells, number fields = 12; total number of lateral membranes = 120, (n = 120). (E) Quantitation for blots were performed in triplicates over three separate experiments each in triplicates (n = 6). Protein levels were normalized using GAPDH for total, soluble, and insoluble fractions. Numbers are the mean from those experiments with SDs calculated for each data set (error bars). Scale bars, 20 μm.
Figure 7.
Figure 7.
Adducin is necessary to maintain cell shape and restrict basal accumulation of lateral membrane proteins. (A) View from top of a monolayer stained with E-cadherin reveals changes to cross-sectional surface area. View from XZ plane in both HBECTL and HBEADD1 cells stained through markers for the lateral membrane including; E-cadherin, Na/K ATPase, and Ankyrin-G. Resident lateral membrane proteins can often be seen accumulating at the basal surface of adducin depleted cells (B). Arrows points to effected HBE cells. (C) Normal HBE cells were seeded with HBECTL cells at a 10:1 ratio and induced with doxycycline for 72 h. HBECTL cells are identified through GFP expression and display normal lateral membrane shape and epithelial morphology. HBEADD1 cells are also identified through GFP expression and can be seen to display curvature of the lateral membrane combined with increased number of cell–cell contacts. (D) Thirty-six percent of adducin-depleted cells display loss of normal epithelial morphology, whereas only 3% of control cells show similar changes to cell shape; n = 31 HBECTL, n = 33 HBEADD1. (E) Measurement of cell–cell contact numbers seen in both GFP-positive cell populations; 30 cells were imaged and counted for each group and were displayed as function of the number of cell–cell contacts. Scale bars, (XY) 20 μm; (XZ) 10 μm.
Figure 8.
Figure 8.
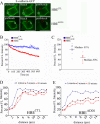
The mobile fraction of E-cadherin-GFP is increased in cells lacking α-adducin. (A) HBEADD1 or HBECTL cells were transfected with E-cadherin-GFP. After 24 h cells were treated with 100 ng/ml doxycycline for 72 h. Photobleaching was carried out at sites of cell–cell contact using a single FRAP configuration that consistently resulted in 60–70% reduction of immunofluorescence. Shown here is a representative bleach experiment from E-cadherin-GFP expressed in either HBECTL or HBEADD1 cells with the bleached area marked with a red rectangle. The typical increase in recovery can be seen for the E-cadherin-GFP transfected into the HBEADD1 cell line. (B) E-cadherin-GFP was bleached and allowed to recover for 2 min, with fluorescence recovery captured at 1-s intervals. Normalized fluorescence was calculated using corrections for background signal and acquisition bleaching and plotted versus time in seconds. (C) Mobile fraction of E-cadherin-GFP was calculated using the Phair method. Median mobile fractions are 0.31 for HBECTL and 0.55 for HBEADD1. A scatter plot of each calculated mobile fraction is presented to show variations from the median; n = 29 HBECTL, n = 28 HBEADD1. Scale bars, 10 μm.
Figure 9.
Figure 9.
Enhanced long range mobility of E-cadherin-GFP in adducin-depleted cells. (A) E-cadherin-GFP was bleached repeatedly every 10 s for 10 min, with images collected every 5 s. Region of interest (ROI) 1 (red square) represents the bleached region, whereas ROI2 (white square) is the site used to monitor loss of fluorescence. (B) Loss in fluorescence was plotted for E-cadherin-GFP in both HBECTL and HBEADD1 cells after corrections for background signal and fluorescence lost during image acquisition. ROI2 for HBECTL is plotted in blue; ROI2 for HBEADD1 is plotted in red. Curves represent the median fluorescence from 15 samples in both cell lines. (C) A scatter plot of fluorescence from all samples is shown to display variations from the median; n = 15 HBECTL, n = 15 HBEADD1. (D and E) Fluorescence intensity was measured as a function of distance from ROI1. Intensities were measured every 1.2 μm from ROI1 up to 16.8 μm away, representing 15 ROIs. Three time points were used to measure fluorescence intensities reflecting changes to signal levels from prebleach levels at time 0 min: blue, 1 min; maroon, 5 min; and red, 10 min. (D) Left graph, HBECTL cells; (E) right graph, HBEADD1 cells. Scale bars, 10 μm.

References

    1. Barkalow K. L., Italiano J. E., Jr., Chou D. E., Matsuoka Y., Bennett V., Hartwig J. H. Alpha-adducin dissociates from F-actin and spectrin during platelet activation. J. Cell Biol. 2003;161(3):557–570. - PMC - PubMed
    1. Bennett V., Gardner K., Steiner J. P. Brain adducin: a protein kinase C substrate that may mediate site-directed assembly at the spectrin-actin junction. J. Biol. Chem. 1988;263(12):5860–5869. - PubMed
    1. Bennett V., Baines A. J. Spectrin and ankyrin-based pathways: metazoan inventions for integrating cells into tissues. Physiol Rev. 2001;81(3):1353–1392. - PubMed
    1. Chen H., et al. Combined deletion of mouse dematin-headpiece and beta-adducin exerts a novel effect on the spectrin-actin junctions leading to erythrocyte fragility and hemolytic anemia. J. Biol. Chem. 2007;282(6):4124–4135. - PubMed
    1. Davis J. Q., Bennett V. The anion exchanger and Na+K(+)-ATPase interact with distinct sites on ankyrin in in-vitro assays. J. Biol. Chem. 1990;265(28):17252–17256. - PubMed

Publication types

MeSH terms

LinkOut - more resources