. 2007:3:144.
doi: 10.1038/msb4100188. Epub 2007 Nov 13.

Ligand-dependent responses of the ErbB signaling network: experimental and modeling analyses

Affiliations

Ligand-dependent responses of the ErbB signaling network: experimental and modeling analyses

Marc R Birtwistle et al. Mol Syst Biol. 2007.

Abstract

Deregulation of ErbB signaling plays a key role in the progression of multiple human cancers. To help understand ErbB signaling quantitatively, in this work we combine traditional experiments with computational modeling, building a model that describes how stimulation of all four ErbB receptors with epidermal growth factor (EGF) and heregulin (HRG) leads to activation of two critical downstream proteins, extracellular-signal-regulated kinase (ERK) and Akt. Model analysis and experimental validation show that (i) ErbB2 overexpression, which occurs in approximately 25% of all breast cancers, transforms transient EGF-induced signaling into sustained signaling, (ii) HRG-induced ERK activity is much more robust to the ERK cascade inhibitor U0126 than EGF-induced ERK activity, and (iii) phosphoinositol-3 kinase is a major regulator of post-peak but not pre-peak EGF-induced ERK activity. Sensitivity analysis leads to the hypothesis that ERK activation is robust to parameter perturbation at high ligand doses, while Akt activation is not.


Figures

Figure 1
Figure 1
Simplified schematic representation of the ErbB signaling model. ErbB receptor ligands (EGF and HRG) activate different ErbB receptor dimer combinations, leading to recruitment of various adapter proteins (Grb2, Shc, and Gab1) and enzymes (PTP1-B, SOS, and RasGAP). These membrane recruitment steps eventually lead to the activation of ERK and Akt.
Figure 2
Figure 2
Reaction network diagram of the ErbB signaling model. Net reaction rates are labeled according to their index. Double-sided line-head arrows depict reversible binding reactions. Single-sided solid-head arrows with solid lines depict chemical transformation, while those with dotted lines depict a potentially multistep chemical reaction process. Single-sided double solid-head arrows depict summation into a Σ-state. (A) Ligand binding, receptor dimerization, receptor autophosphorylation, and primary receptor binding. (B) Membrane recruitment and phosphorylation of intermediate signaling proteins. Σ-states are summations over specific membrane-localized species with identical downstream signaling activity and membrane-anchorage. Detailed explanations Σ-states can be found in Table I and the main text. (C) PTP-1B-mediated dephosphorylation reactions. (D) PIP3-mediated Akt activation. (E) Ras-mediated ERK activation. (F) ERK-mediated feedback. E, EGF; H, HRG; Ei, ErbBi; EijX, ErbB homo- or heterodimer bound to protein X; G, Grb2; S, Shc; I, PI-3K; T, PTP-1B; O, SOS; A, Gab1; R, RasGAP; RsD, Ras-GDP; RsT, Ras-GTP; P2, PIP2; P3, PIP3; P denotes tyrosine phosphorylation, PT denotes threonine/serine phosphorylation, and *denotes activation.
Figure 3
Figure 3
Composition of the multi-domain proteins (A) Grb2 and (B) Gab1. Grb2 has C- and N-terminal SH3 domains that bind to Gab1 and SOS, respectively, and an SH2 domain. GAB1 has a PH domain, a PRD, and several tyrosine phosphorylation sites. SH3 domains bind to proline-rich domains, PH domains bind to phospholipids such as PIP3, while SH2 domains bind to phosphotyrosine. SH3, Src homology 3; SH2, Src homology 2; PH, Pleckstrin homology; PRD, proline-rich domain; pY: phosphotyrosine.
Figure 4ab
Figure 4ab
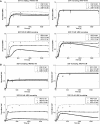
Dynamic and dose response of the ErbB signaling network in MCF-7 cells. Data were normalized as described in Materials and methods. (A) ERK activation in response to simultaneous EGF and HRG stimulation. (B) Akt activation in response to simultaneous EGF and HRG stimulation.
Figure 4c
Figure 4c
(C) Comparison of EGF and HRG responses for various network nodes.
Figure 5
Figure 5
Effect of various negative feedback loops on ERK and Akt activity. Plots correspond to complete inhibition of (A) PTP1-B, (B) ERK feedback to ErbB receptors, (C) ERK feedback to SOS, (D) ERK feedback to Gab1, (E) RasGAP phosphorylation, and (F) Ligand-induced 1-1 homodimer degradation. The y-axis represents the fractional change of activity over the non-perturbed case, calculated as (A*perturbA*base)/A*base, where A denotes the concentration of ERK* or Akt*. The ordered pair x-axis labels represent the ligand doses as ([EGF], [HRG]) in nM.
Figure 6
Figure 6
Effect of 10-fold ErbB2 overexpession. (A) Simulations of EGF- and HRG-induced ERK (left) and Akt activation (right) under wild-type (WT) and ErbB2 overexpression conditions. (B) Setting the on and off rates of PTP-1B for 1-1 and 1-2 receptors equal to each other causes ErbB2 overexpression to increase rather than decrease EGF-induced peak Akt activation.
Figure 7
Figure 7
U0126 Titration of 5 min ERK activation. (A) Immunoblots are representative of two independent experiments. U0126 concentrations are as follows: (0): control; (1): 10 μM; (2): 5 μM; (3): 1 μM; (4): 500 nM; (5): 250 nM; (6): 125 nM; (7): 62 nM; and (8): 0 nM. (B) Comparison of the experimental U0126 titration and model predictions. Error bars represent the range of the data. ERK activity for each ligand is normalized to its own control, and not a single reference point.
Figure 8
Figure 8
Effect of wortmannin on EGF- and HRG-induced ERK activation dynamics. (A) Immunoblots are representative of three independent experiments. Wortmannin concentration used was 100 nM. (B) Data are normalized as described in Materials and methods, to the 5 min no wortmannin point. Error bars correspond to standard deviations.

References

    1. Adams GP, Weiner LM (2005) Monoclonal antibody therapy of cancer. Nat Biotechnol 23: 1147–1157 - PubMed
    1. Agazie YM, Hayman MJ (2003) Molecular mechanism for a role of SHP2 in epidermal growth factor receptor signaling. Mol Cell Biol 23: 7875–7886 - PMC - PubMed
    1. Baulida J, Kraus MH, Alimandi M, Di Fiore PP, Carpenter G (1996) All ErbB receptors other than the epidermal growth factor receptor are endocytosis impaired. J Biol Chem 271: 5251–5257 - PubMed
    1. Berger MB, Mendrola JM, Lemmon MA (2004) ErbB3/HER3 does not homodimerize upon neuregulin binding at the cell surface. FEBS Lett 569: 332–336 - PubMed
    1. Blinov ML, Faeder JR, Goldstein B, Hlavacek WS (2006) A network model of early events in epidermal growth factor receptor signaling that accounts for combinatorial complexity. Biosystems 83: 136–151 - PubMed

Publication types

MeSH terms