

Validation and clinical application of a first order step response equation for nitrogen clearance during FRC measurement
- PMID: 18004668
- PMCID: PMC2798958
- DOI: 10.1007/s10877-007-9101-0
Validation and clinical application of a first order step response equation for nitrogen clearance during FRC measurement
Abstract
Objective: To derive a difference equation based on mass conservation and on alveolar tidal volumes for the calculation of Functional Residual Capacity. Derive an equation for the FRC from the difference equation. Furthermore, to derive and validate a step response equation as a solution of the difference equation within the framework of digital signal processing where the FRC is known a priori.
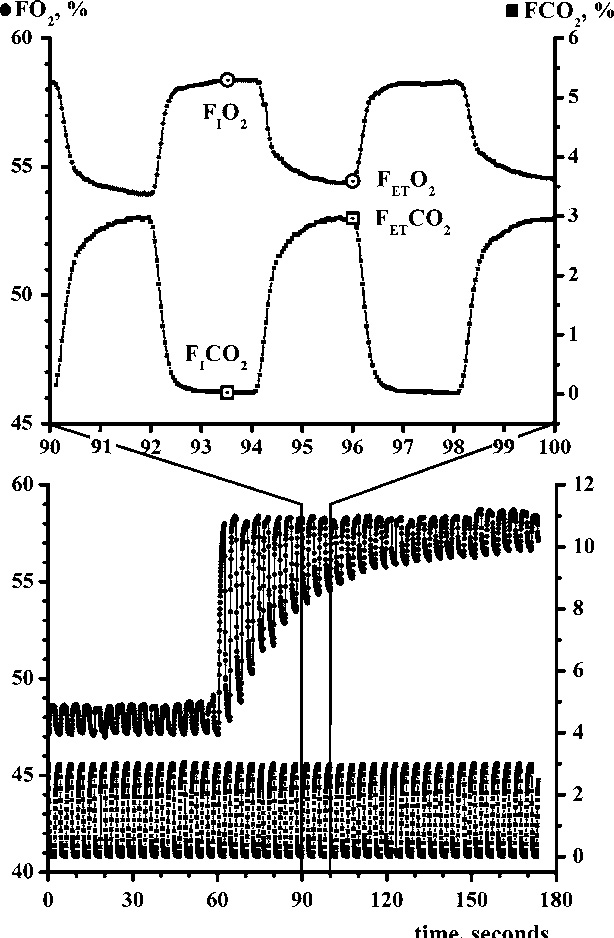
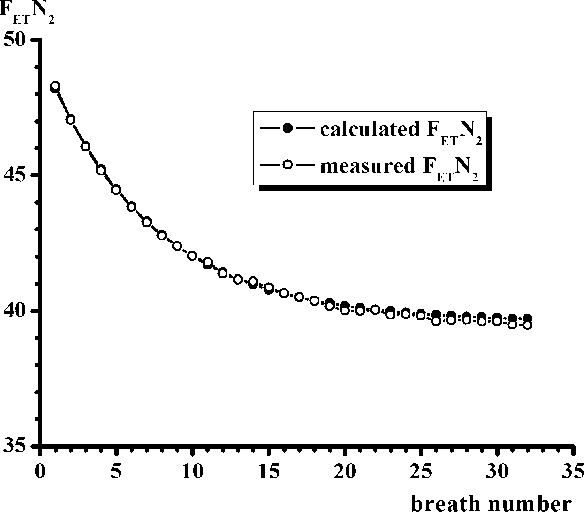
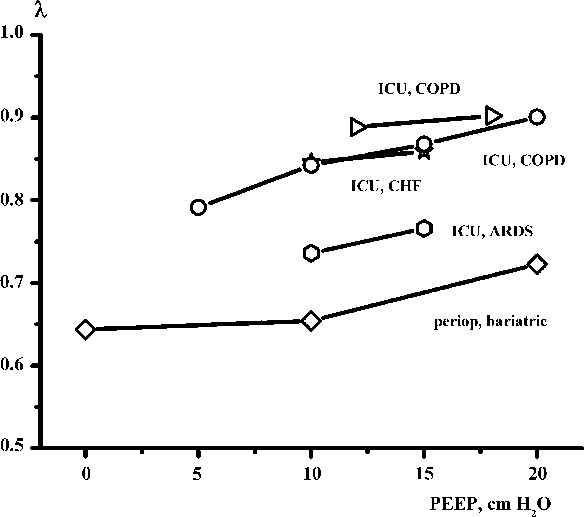
Methods: A difference equation for the calculation of Functional Residual Capacity is derived and solved as step response of a first order system. The step response equation calculates endtidal fractions of nitrogen during multiple breath nitrogen clearance. The step response equation contains the eigenvalue defined as the ratio of FRC to the sum of FRC and alveolar tidal ventilation. Agreement of calculated nitrogen fractions with measured fractions is demonstrated with data from a metabolic lung model, measurements from patients in positive pressure ventilation and volunteers breathing spontaneously. Examples of eigenvalue are given and compared between diseased and healthy lungs and between ventilatory settings.
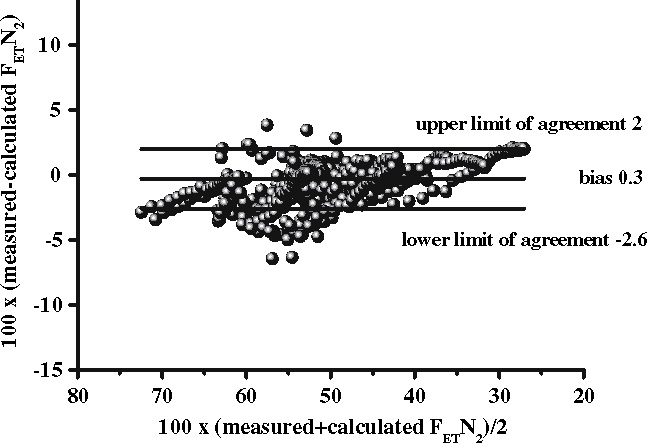
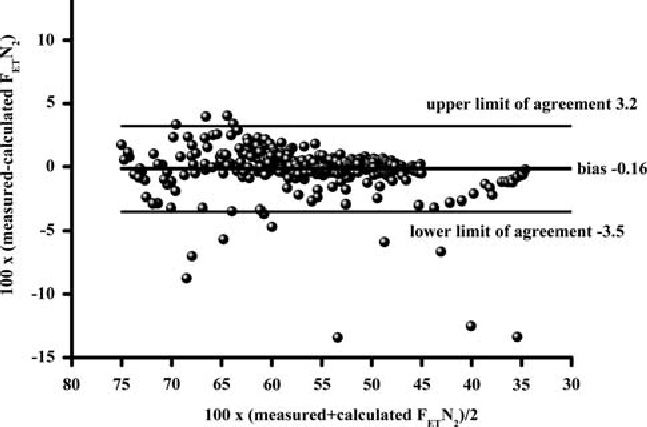
Results: Comparison of calculated and measured fractions of endtidal nitrogen demonstrates a high degree of agreement in terms of regression and bias and limits of agreement (precision) in Bland & Altman analysis. Examples illustrate the use of the eigenvalue as a possible discriminator between disease states.
Conclusion: The first order step response equation reliably calculates endtidal fractions of nitrogen during washout based on a Functional Residual Capacity. The eigenvalue may be a clinically valuable index alone or in conjunction with other indices in the analysis of respiratory states and may aid in the setting of the ventilator.
Figures

References
-
- Lilly JC. Mixing of gases within respiratory system with a new type nitrogen meter. Am J Physiol. 1950;161:342–351. - PubMed
-
- Wrigge H, Sydow M, Zinserling J, Neumann P, Hinz J, Burchardi H. Determination of functional residual capacity (FRC) by multibreath nitrogen washout in a lung model and in mechanically ventilated patients. Accuracy depends on continuous dynamic compensation for changes of gas sampling delay time. Intensive Care Med. 1998;24:487–493. doi: 10.1007/s001340050601. - DOI - PubMed
Publication types
MeSH terms
Substances
LinkOut - more resources
Full Text Sources
