

Synaptic proteins, neuropathology and cognitive status in the oldest-old
- PMID: 18006193
- PMCID: PMC7295175
- DOI: 10.1016/j.neurobiolaging.2007.10.001
Synaptic proteins, neuropathology and cognitive status in the oldest-old
Abstract
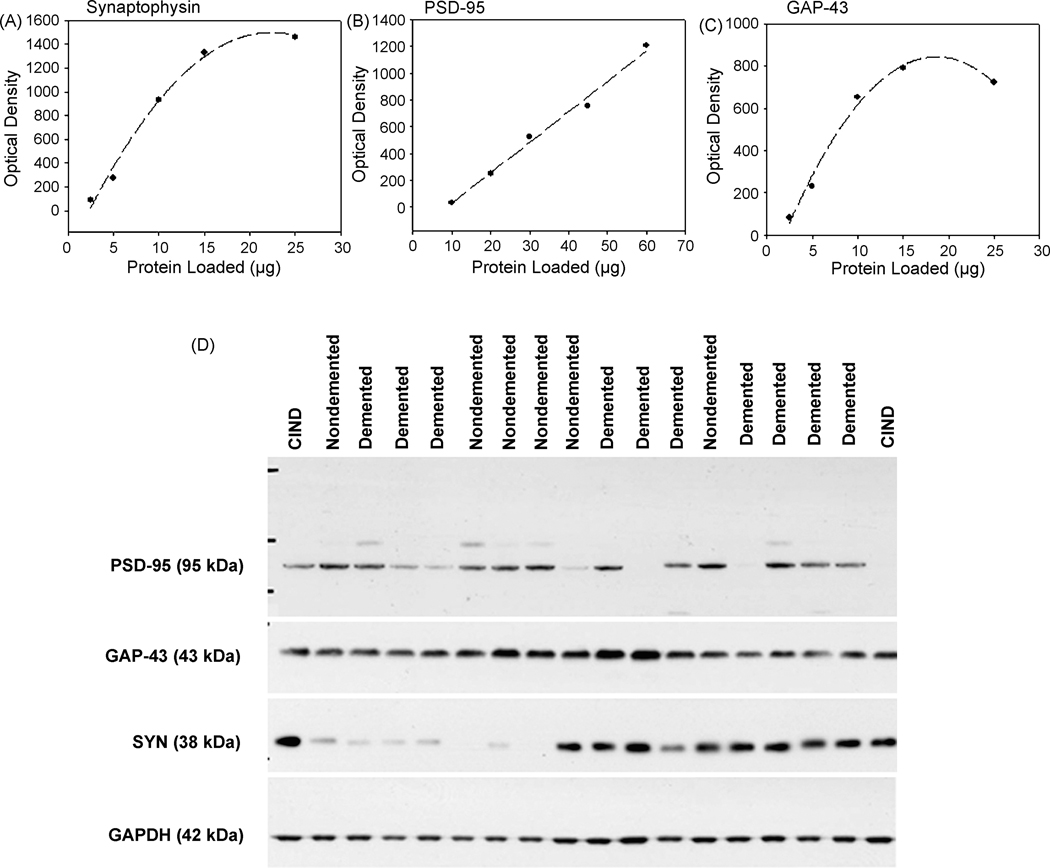
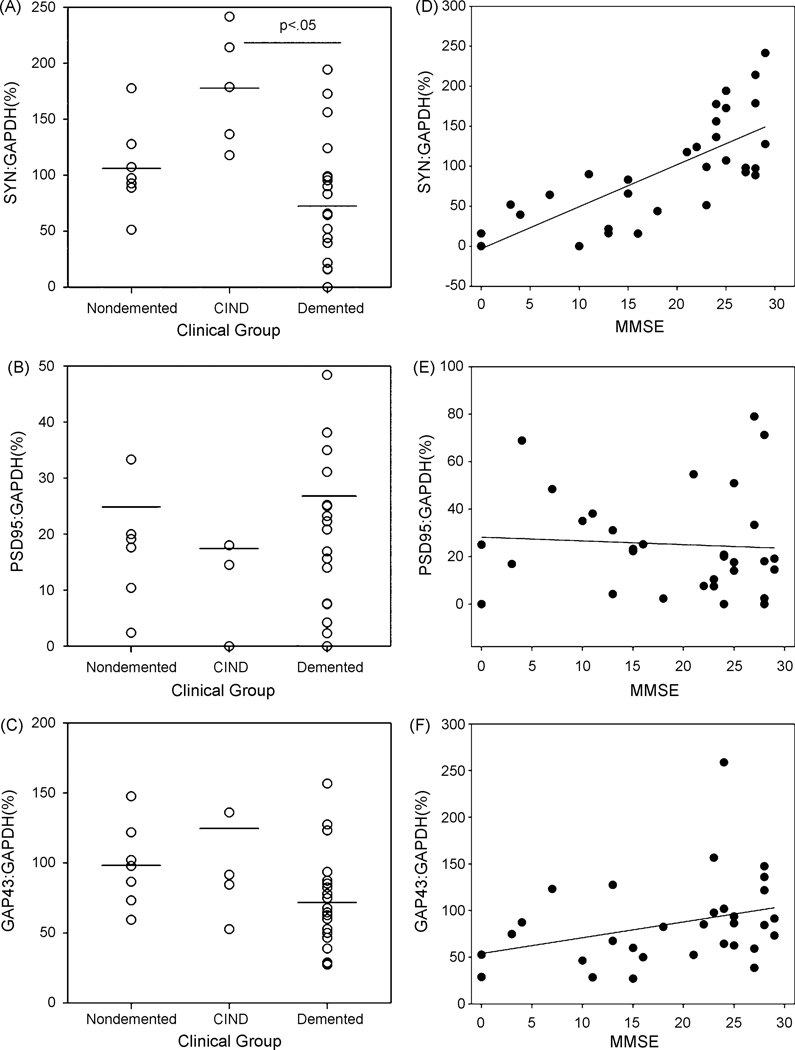
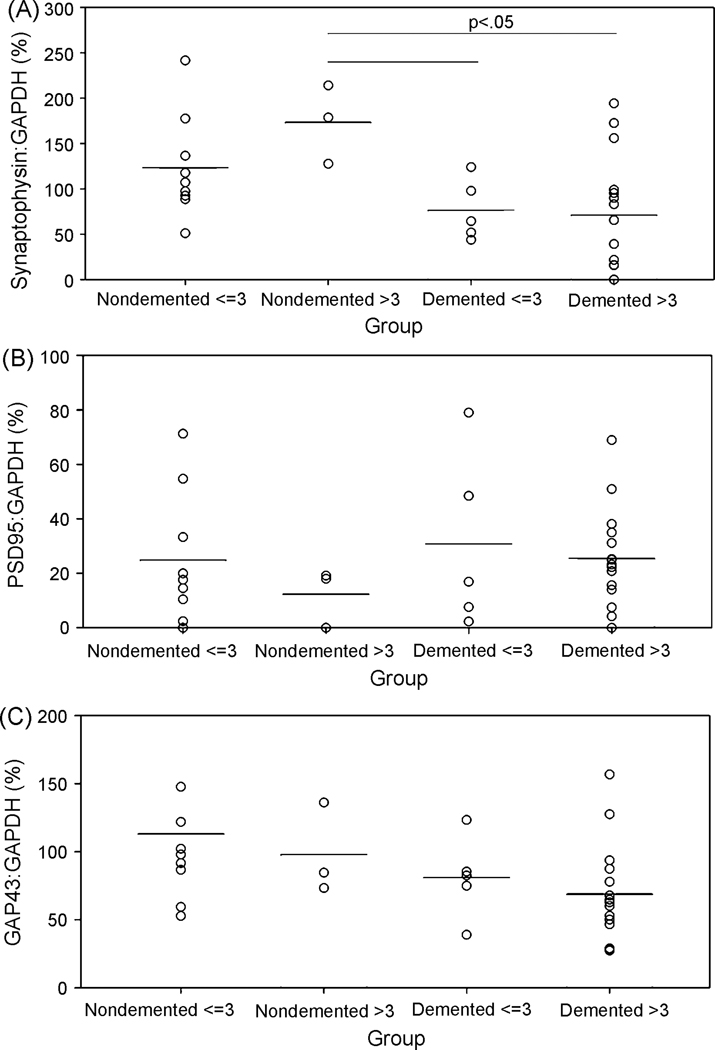
An increasing number of individuals in our population are surviving to over 90 years and a subset is at risk for developing dementia. However, senile plaque and neurofibrillary tangle pathology do not consistently differentiate individuals with and without dementia. Synaptic protein loss is a feature of aging and dementia and may dissociate 90+ individuals with and without dementia. Synaptophysin (SYN), postsynaptic density 95 (PSD-95) and growth-associated protein 43 (GAP-43) were studied in the frontal cortex of an autopsy series of 32 prospectively followed individuals (92-105 years) with a range of cognitive function. SYN protein levels were decreased in individuals with dementia and increased in those with clinical signs of cognitive impairment insufficient for a diagnosis of dementia. SYN but neither PSD-95 nor GAP-43 protein levels were significantly correlated with mini-mental status examination (MMSE) scores. Frontal cortex SYN protein levels may protect neuronal function in oldest-old individuals and reflect compensatory responses that may be involved with maintaining cognition.
Figures
References
-
- Akram A, Christoffel D, Rocher AB, Bouras C, Kovari E, Perl DP, Morrison JH, Herrmann FR, Haroutunian V, Giannakopoulos P, Hof PR. Stereologic estimates of total spinophilin-immunoreactive spine number in area 9 and the CA1 field: Relationship with the progression of Alzheimer’s disease. Neurobiol Aging 2007. - PMC - PubMed
-
- Alafuzoff L, Iqbal K, Friden H, Adolfsson R and Winblad B Histopathological criteria for progressive dementia disorders: clinical-pathological correlation and classification by multivariate analysis. Acta Neuropathologica (Berlin) 1987;74:209–25. - PubMed
-
- Alford MF, Masliah E, Hansen LA, Terry RD. A simple dot-immunobinding assay for quantification of synaptophysin-like immunoreactivity in human brain. J Histochem Cytochem 1994;42(2):283–7. - PubMed
-
- Almeida CG, Tampellini D, Takahashi RH, Greengard P, Lin MT, Snyder EM, Gouras GK. Beta-amyloid accumulation in APP mutant neurons reduces PSD-95 and GluR1 in synapses. Neurobiol Dis 2005;20(2):187–98. - PubMed
-
- Association AP. Diagnostic and statistical manual of mental disorders. 4th ed Washington, DC.: American Psychiatric Association; 1994.
Publication types
MeSH terms
Substances
Grants and funding
LinkOut - more resources
Full Text Sources
Medical
Miscellaneous
