. 2008 Jan;101(1):73-87.
doi: 10.1093/aob/mcm288. Epub 2007 Nov 14.

Eelgrass meadows in the California Channel Islands and adjacent coast reveal a mosaic of two species, evidence for introgression and variable clonality

Affiliations

Eelgrass meadows in the California Channel Islands and adjacent coast reveal a mosaic of two species, evidence for introgression and variable clonality

J A Coyer et al. Ann Bot. 2008 Jan.

Abstract

Background and aims: Seagrasses are important facilitator species in shallow, soft-bottom marine environments worldwide and, in many places, are threatened by coastal development and eutrophication. One narrow-leaved species (Zostera marina) and one wide-leaved species, variously designated as Z. marina, Z. pacifica or Z. asiatica, are found off the California Channel Islands and adjacent California-Mexico coast. The aim of the present study was to confirm species identification genetically and to link patterns of genetic diversity, connectivity and hybridization among and within the populations with historical sea levels (Ice Age) or the contemporary environment.

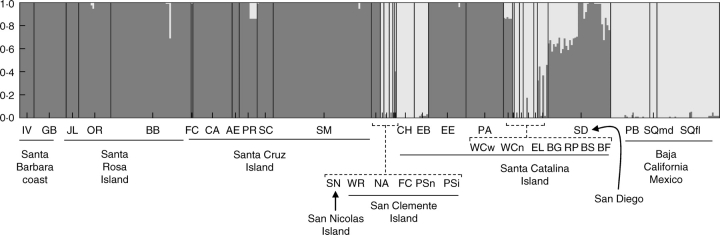
Methods: Samples (n = 11-100) were collected from 28 sites off five California Channel Islands and six sites off the adjacent coast of southern California and Baja California, Mexico. DNA polymorphisms of the rDNA-ITS (internal transcribed spacer) cistron (nuclear), the matK intron (chloroplast) and nine microsatellite loci (nuclear) were examined in a population genetic and phylogeographic context.

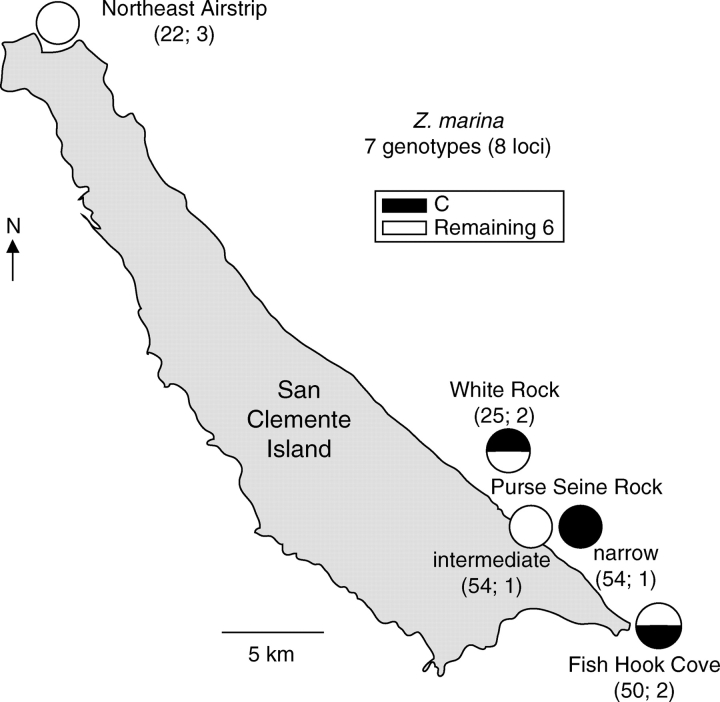
Key results: All wide-leaved individuals were Z. pacifica, whereas narrow-leaved forms were Z. marina. Microsatellite genotypes were consistent with hybridization between the two species in three populations. The present distribution of Z. pacifica follows a glacial age land mass rather than present oceanographic regimes, but no link was observed between the present distribution of Z. marina and past or present environments. Island populations of Z. marina often were clonal and characterized by low genotypic diversity compared with populations along the Baja California coast. The high level of clonal connectivity around Santa Catalina Island indicated the importance of dispersal and subsequent re-establishment of vegetative fragments.

Conclusions: The pristine environmental conditions of offshore islands do not guarantee maximum genetic diversity. Future restoration and transplantation efforts of seagrasses must recognize cryptic species and consider the degree of both genetic and genotypic variation in candidate donor populations.


Figures

F<sc>ig</sc>. 1.
Fig. 1.
The Southern California Bight. Circles indicate populations sampled: filled, narrow-leaved Zostera; open, wide-leaved Zostera. The solid black arrow depicts surface flow of the sub-arctic California Current flowing from the north; the solid grey arrow shows the warm, saline central north Pacific water mass flowing from the west; and the broken arrow shows the warm, highly saline Equatorial Pacific water mass flowing in from the south, which becomes warmer in the summer and autumn (Browne, 1994). Approximate LGM boundaries of the 10 m depth contour around Santarosae and San Nicolas are indicated (but not for other areas) (see text and Graham et al., 2003 for details). The insert map shows the location of the Channel Islands and the populations collected from Baja California, Mexico; PB, Estero Punta Banda; SQ, San Quintin Bay.
F<sc>ig</sc>. 2.
Fig. 2.
Phylogenetic tree based on 477 bp concatenated nrDNA ITS1 and ITS2 sequences. Numbers above and below the line are Bayesian posterior probability values and MP bootstrap values (1000 replications), respectively. Optimal model of evolution = HKY, burn-in = 9000, generations = 2 000 000 (see text). As each member of a multiple member clade has identical sequences, a GenBank accession number (EF prefix) is provided for only one member; sequences of other species (AY or AB prefix) were obtained from GenBank.
F<sc>ig</sc>. 3.
Fig. 3.
Phylogenetic tree based on 718 bp matK (chloroplast intron) sequences. Numbers above and below the line are Bayesian posterior probability values and MP bootstrap values (1000 replications), respectively. Optimal model of evolution = GTR, burn-in = 9000, generations = 2 000 000 (see text). GenBank accession numbers are as in the legend for Fig. 2.
F<sc>ig</sc>. 4.
Fig. 4.
Leaf widths of Z. marina and Z. pacifica. Measurements are from ten individuals at each site (with 95% CI indicated); abbreviations are listed in Table 1.
F<sc>ig</sc>. 5.
Fig. 5.
Neighbor-joining tree illustrating the relationships among California Channel Islands and Baja California populations of Z. marina and Z. pacifica. The tree was based on pairwise Cavalli-Sforza and Edwards' chord distance (Cavalli-Sforza and Edwards, 1967) between genotypes only, using eight microsatellite loci (locus CT20 excluded). Bootstrap values were derived from 1000 resamplings. Abbreviations are listed in Table 1.
F<sc>ig</sc>. 6.
Fig. 6.
Genotype sharing among populations of Z. pacifica (coloured) and Z. marina (grey/white) on Santa Catalina Island (top) and Northern Channel Islands (bottom). Eight microsatellite loci (locus CT20 excluded) were used for Z. pacifica and nine (locus CT20 included) for Z. marina. The category ‘others’ refers to genotypes not shared among two or more populations. Parenthetical values: number of ramets; number of genotypes. Pie diagrams represent the proportion of total genotypes in a population that are shared or not shared.
F<sc>ig</sc>. 7.
Fig. 7.
Microsatellite detection of admixture (introgression) using the program STRUCTURE (Pritchard et al., 2000). Each individual is represented in the figure by a vertical bar partitioned into dark or light grey segments. The length of each segment is proportional to the individual's membership in each of two clusters (K) representing the parental species, thereby providing a quantitative illustration of introgression. Dark grey represents Z. pacifica, light grey Z. marina. Populations are separated by the vertical black lines; abbreviations are given in Table 1.
F<sc>ig</sc>. 8.
Fig. 8.
Genotype sharing among populations of Z. marina on San Clemente Island. See the legend for Fig. 6.

References

    1. Alberto F, Arnaud-Haond S, Duarte CM, Serrão EA. Genetic diversity of a clonal angiosperm near its range limit: the case of Cymodocea nodosa at the Canary Islands. Marine Ecology Progress Series. 2006;309:117–129.
    1. Alstatt J. Restoration of a historic eelgrass (Zostera marina) bed at Frenchy's Cove, Anacapa Island. In: Garcelon DK, Schwemm CA, editors. Proceedings of the Sixth California Islands Symposium. Arcata: Institute for Wildlife Studies; 2003. pp. 397–404.
    1. Amos W. The hidden value of missing genotypes. Molecular Biology and Evolution. 2006;23:1995–1996. - PubMed
    1. Anonymous. Southern California eelgrass mitigation policy. Southwest Regional Office, National Marine Fisheries Service, NOAA; 1991.
    1. Anonymous. Understanding marine biodiversity. Washington, DC: National Research Council, National Academy Press; 1995.

Publication types