

Potential confounding of particulate matter on the short-term association between ozone and mortality in multisite time-series studies
- PMID: 18007990
- PMCID: PMC2072830
- DOI: 10.1289/ehp.10108
Potential confounding of particulate matter on the short-term association between ozone and mortality in multisite time-series studies
Abstract
Background: A critical question regarding the association between short-term exposure to ozone and mortality is the extent to which this relationship is confounded by ambient exposure to particles.
Objectives: We investigated whether particulate matter < 10 and < 2.5 microm in aerodynamic diameter (PM(10) and PM(2.5)) is a confounder of the ozone and mortality association using data for 98 U.S. urban communities from 1987 to 2000.
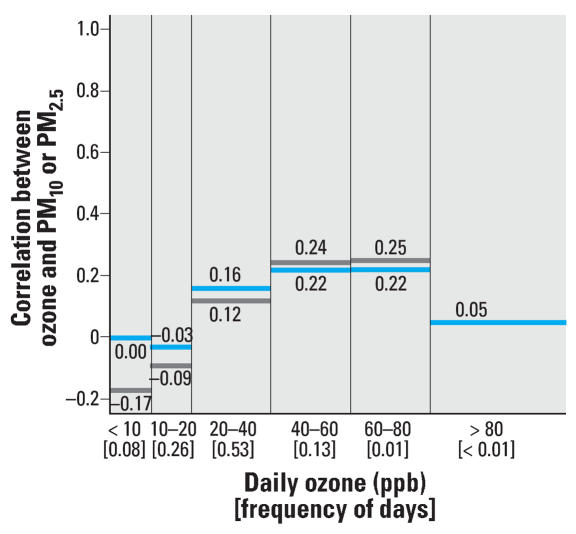
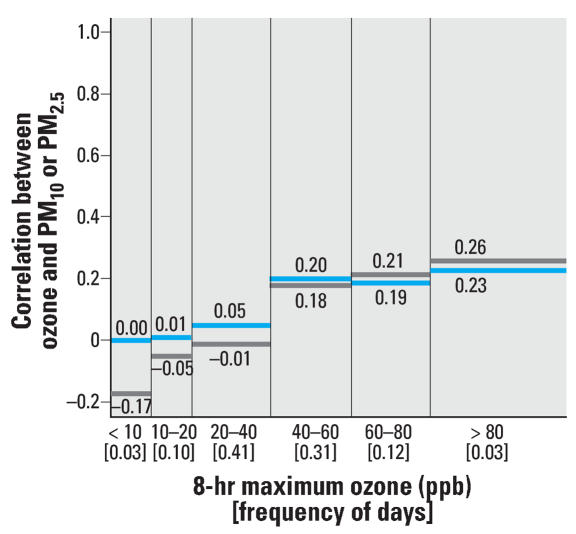
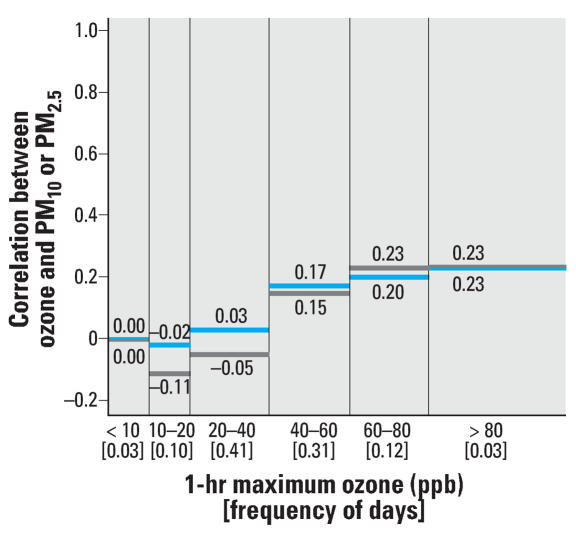
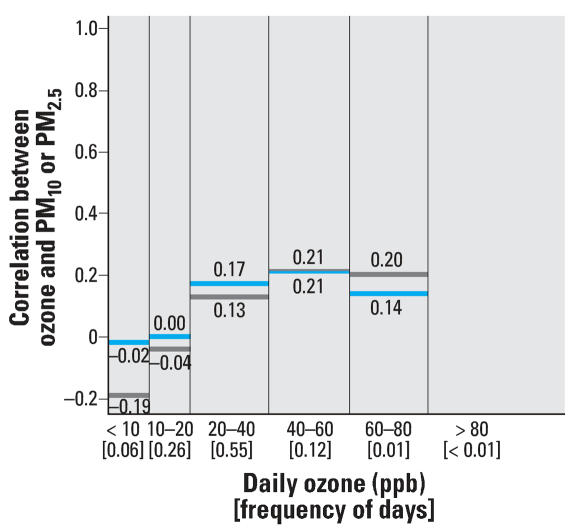
Methods: We a) estimated correlations between daily ozone and daily PM concentrations stratified by ozone or PM levels; b) included PM as a covariate in time-series models; and c) included PM as a covariate as in d), but within a subset approach considering only days with ozone below a specified value.
Results: Analysis was hindered by data availability. In the 93 communities with PM(10) data, only 25.0% of study days had data on both ozone and PM(10). In the 91 communities with PM(2.5) data, only 9.2% of days in the study period had data on ozone and PM(2.5). Neither PM measure was highly correlated with ozone at any level of ozone or PM. National and community-specific effect estimates of the short-term effects of ozone on mortality were robust to inclusion of PM(10) or PM(2.5) in time-series models. The robustness remains even at low ozone levels (< 10 ppb) using a subset approach.
Conclusions: Results provide evidence that neither PM(10) nor PM(2.5) is a likely confounder of observed ozone and mortality relationships. Further investigation is needed to investigate potential confounding of the short-term effects of ozone on mortality by PM chemical composition.
Keywords: PM10; PM2.5; confounding; mortality; ozone; particulate matter; sensitivity analysis.
Figures
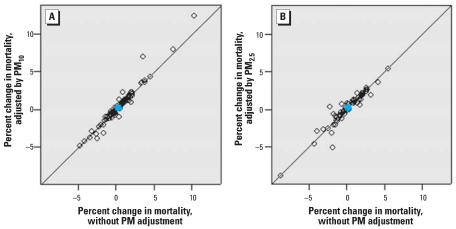
 ), with and without adjustment by PM10 (A) and PM2.5 (B) at lag 1 day. Open symbols represent community-specific estimates; blue circles represent overall national effects.
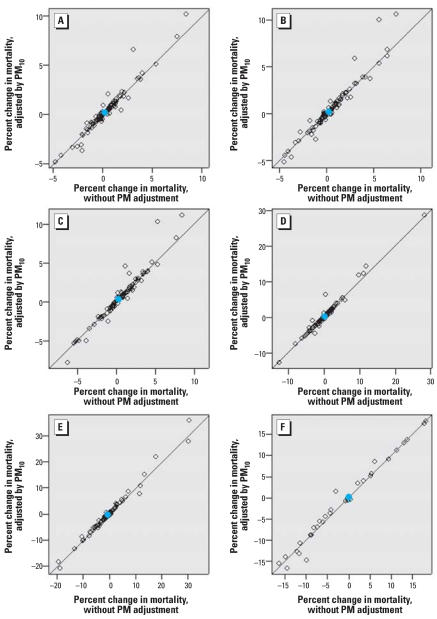 ozone levels, with and without adjustment by PM10 at lag 1 day, using the subset approach. (A) 93 communities, s = 60; (B) 93 communities, s = 50; (C) 93 communities, s = 40; (D) 91 communities, s = 30; (E) 83 communities, s = 20; (F) 34 communities, s = 10. The analysis without adjustment by PM includes only days for which lag 1 PM10 data are available. Only days with ozone data < s are included. Open symbols represent community-specific estimates; blue circles represent overall national effects.
References
-
- Anderson HR, Atkinson RW, Peacock JL, Marston L, Konstantinou K. Meta-Analysis of Time-Series Studies and Panel Studies of Particulate Matter (PM) and Ozone (O3) Copenhagen: World Health Organization; 2004.
Publication types
MeSH terms
Substances
Grants and funding
LinkOut - more resources
Full Text Sources
Medical