

Characterization of source-specific air pollution exposure for a large population-based Swiss cohort (SAPALDIA)
- PMID: 18007997
- PMCID: PMC2072852
- DOI: 10.1289/ehp.10177
Characterization of source-specific air pollution exposure for a large population-based Swiss cohort (SAPALDIA)
Abstract
Background: Although the dispersion model approach has been used in some epidemiologic studies to examine health effects of traffic-specific air pollution, no study has evaluated the model predictions vigorously.
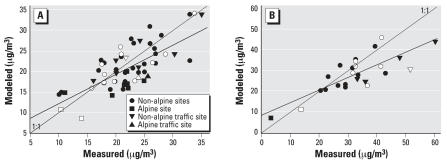
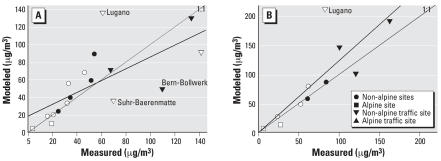
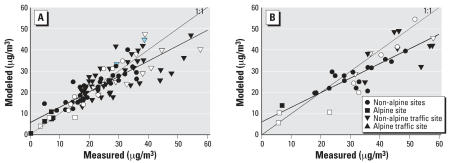
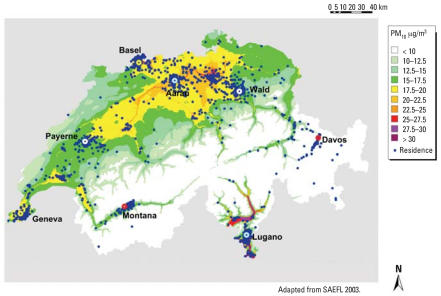
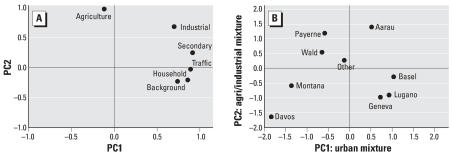
Methods: We evaluated total and traffic-specific particulate matter < 10 and < 2.5 microm in aero-dynamic diameter (PM(10), PM(2.5)), nitrogren dioxide, and nitrogen oxide concentrations predicted by Gaussian dispersion models against fixed-site measurements at different locations, including traffic-impacted, urban-background, and alpine settings between and across cities. The model predictions were then used to estimate individual subjects' historical and cumulative exposures with a temporal trend model.
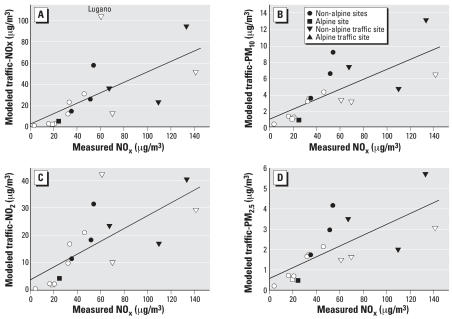
Results: Modeled PM(10) and NO(2) predicted at least 55% and 72% of the variability of the measured PM(10) and NO(2), respectively. Traffic-specific pollution estimates correlated with the NO(x) measurements (R(2) >or=0.77) for background sites but not for traffic sites. Regional background PM(10) accounted for most PM(10) mass in all cities. Whereas traffic PM(10) accounted for < 20% of the total PM(10), it varied significantly within cities. The modeling error for PM(10) was similar within and between cities. Traffic NO(x) accounted for the majority of NO(x) mass in urban areas, whereas background NO(x) accounted for the majority of NO(x) in rural areas. The within-city NO(2) modeling error was larger than that between cities.
Conclusions: The dispersion model predicted well the total PM(10), NO(x), and NO(2) and traffic-specific pollution at background sites. However, the model underpredicted traffic NO(x) and NO(2) at traffic sites and needs refinement to reflect local conditions. The dispersion model predictions for PM(10) are suitable for examining individual exposures and health effects within and between cities.
Keywords: cohort study; cumulative exposure; dispersion model; exposure assessment; long-term exposure.
Figures
Similar articles
-
The London low emission zone baseline study.Res Rep Health Eff Inst. 2011 Nov;(163):3-79. Res Rep Health Eff Inst. 2011. PMID: 22315924
-
The impact of the congestion charging scheme on air quality in London. Part 1. Emissions modeling and analysis of air pollution measurements.Res Rep Health Eff Inst. 2011 Apr;(155):5-71. Res Rep Health Eff Inst. 2011. PMID: 21830496
-
Enhancing Models and Measurements of Traffic-Related Air Pollutants for Health Studies Using Dispersion Modeling and Bayesian Data Fusion.Res Rep Health Eff Inst. 2020 Mar;2020(202):1-63. Res Rep Health Eff Inst. 2020. PMID: 32239871 Free PMC article.
-
Estimating traffic contribution to particulate matter concentration in urban areas using a multilevel Bayesian meta-regression approach.Environ Int. 2020 Aug;141:105800. doi: 10.1016/j.envint.2020.105800. Epub 2020 May 28. Environ Int. 2020. PMID: 32474298 Free PMC article. Review.
-
A review of land-use regression models for characterizing intraurban air pollution exposure.Inhal Toxicol. 2007;19 Suppl 1(Suppl 1):127-33. doi: 10.1080/08958370701495998. Inhal Toxicol. 2007. PMID: 17886060 Free PMC article. Review.
Cited by
-
Decreased PM10 exposure attenuates age-related lung function decline: genetic variants in p53, p21, and CCND1 modify this effect.Environ Health Perspect. 2009 Sep;117(9):1420-7. doi: 10.1289/ehp.0800430. Epub 2009 May 26. Environ Health Perspect. 2009. PMID: 19750108 Free PMC article.
-
Examining the representativeness of home outdoor PM(2.5), EC, and OC estimates for daily personal exposures in Southern California.Air Qual Atmos Health. 2012 Sep;5(3):335-351. doi: 10.1007/s11869-010-0099-y. Epub 2010 Oct 15. Air Qual Atmos Health. 2012. PMID: 22942922 Free PMC article.
-
Impacts of highway traffic exhaust in alpine valleys on the respiratory health in adults: a cross-sectional study.Environ Health. 2011 Mar 4;10:13. doi: 10.1186/1476-069X-10-13. Environ Health. 2011. PMID: 21371339 Free PMC article.
-
Traffic-related air pollution associated with prevalence of asthma and COPD/chronic bronchitis. A cross-sectional study in Southern Sweden.Int J Health Geogr. 2009 Jan 20;8:2. doi: 10.1186/1476-072X-8-2. Int J Health Geogr. 2009. PMID: 19154599 Free PMC article.
-
Satellite remote sensing in epidemiological studies.Curr Opin Pediatr. 2016 Apr;28(2):228-34. doi: 10.1097/MOP.0000000000000326. Curr Opin Pediatr. 2016. PMID: 26859287 Free PMC article. Review.
References
-
- Ackermann-Liebrich U, Kuna-Dibbert B, Probst-Hensch NM, Schindler C, Felber Dietrich D, Stutz EZ, et al. Follow-up of the Swiss Cohort Study on Air Pollution and Lung Diseases in Adults (SAPALDIA 2) 1991–2003: methods and characterization of participants. Soz Praventivmed. 2005;50(4):245–263. - PubMed
-
- Ackermann-Liebrich U, Leuenberger P, Schwartz J, Schindler C, Monn C, Bolognini G, et al. Lung function and long term exposure to air pollutants in Switzerland. Am J Respir Crit Care Med. 1997;155(1):122–129. - PubMed
-
- Bayer-Oglesby L, Schindler C, Hazenkamp-von Arx ME, Braun-Fahrlander C, Keidel D, Rapp R, et al. Living near Main Streets and Respiratory Symptoms in Adults. Am J Epidemiol. 2006;164:1190–1198. - PubMed
Publication types
MeSH terms
Substances
LinkOut - more resources
Full Text Sources
Medical
