. 2008 Mar;9(1):102-21.
doi: 10.1007/s10162-007-0102-y. Epub 2007 Nov 14.

Threshold and beyond: modeling the intensity dependence of auditory responses

Affiliations

Threshold and beyond: modeling the intensity dependence of auditory responses

Bernd Lütkenhöner. J Assoc Res Otolaryngol. 2008 Mar.

Abstract

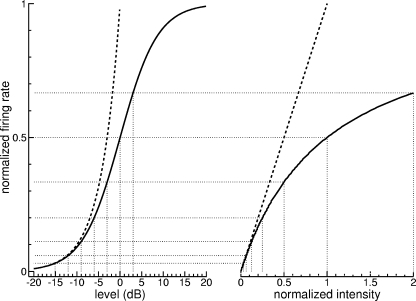
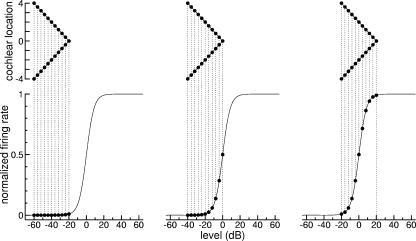
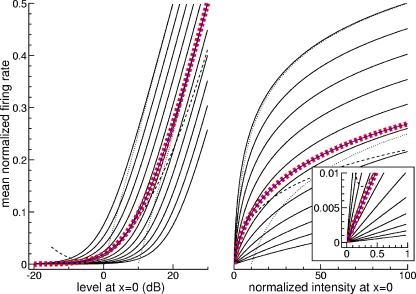
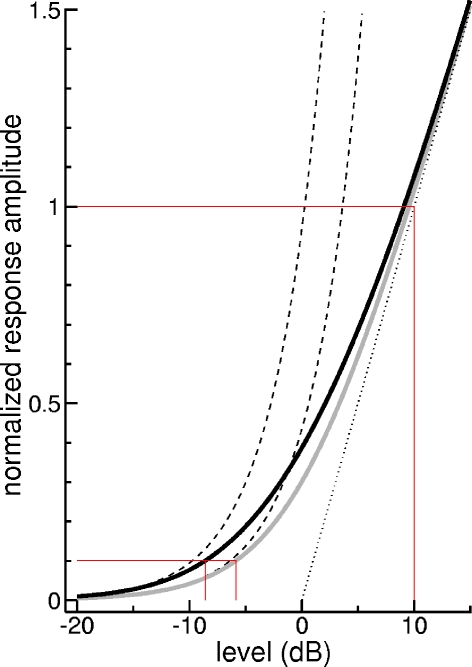
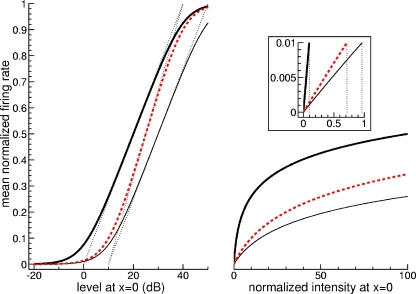
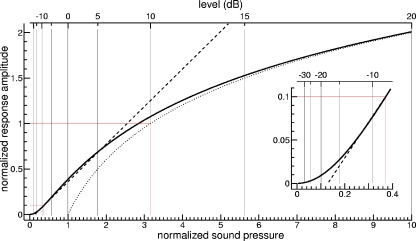
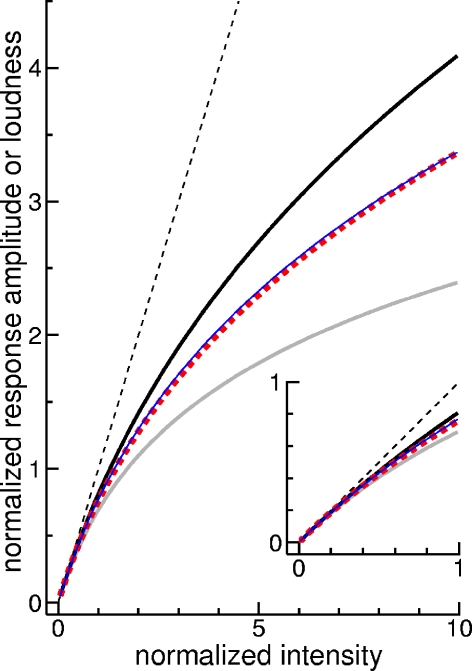
In many studies of auditory-evoked responses to low-intensity sounds, the response amplitude appears to increase roughly linearly with the sound level in decibels (dB), corresponding to a logarithmic intensity dependence. But the auditory system is assumed to be linear in the low-intensity limit. The goal of this study was to resolve the seeming contradiction. Based on assumptions about the rate-intensity functions of single auditory-nerve fibers and the pattern of cochlear excitation caused by a tone, a model for the gross response of the population of auditory nerve fibers was developed. In accordance with signal detection theory, the model denies the existence of a threshold. This implies that regarding the detection of a significant stimulus-related effect, a reduction in sound intensity can always be compensated for by increasing the measurement time, at least in theory. The model suggests that the gross response is proportional to intensity when the latter is low (range I), and a linear function of sound level at higher intensities (range III). For intensities in between, it is concluded that noisy experimental data may provide seemingly irrefutable evidence of a linear dependence on sound pressure (range II). In view of the small response amplitudes that are to be expected for intensity range I, direct observation of the predicted proportionality with intensity will generally be a challenging task for an experimenter. Although the model was developed for the auditory nerve, the basic conclusions are probably valid for higher levels of the auditory system, too, and might help to improve models for loudness at threshold.


Figures

FIG. 1
FIG. 1
Normalized firing rate of an auditory-nerve fiber (according to Yates et al. 1990). The intensity scale is logarithmic on the left (level in dB) and linear on the right. The firing rate is half the maximum rate at a normalized intensity of one (0 dB). The solid curve has a linear low-intensity approximation (dashed curve).
FIG. 2
FIG. 2
A BM displacement as a function of distance from apex (guinea pig data, read from Fig. 1d of Russell and Nilsen 1997). B Same curves as in A, but normalized. The logarithm of BM displacement decreases approximately linearly to both sides of the maximum (dashed lines). C Level dependence of maximum BM displacement. The solid curve represents an empirical fit to the data. BM displacement is assumed to be proportional to sound pressure at low levels (dotted line).
FIG. 3
FIG. 3
From cochlear excitation to firing rate. The upper panels show three cochlear excitation patterns (cochlear location, in arbitrary units, indicated by the vertical scale on the left). The normalized intensity (corresponding level represented by scale at the bottom) has a maximum at location zero, corresponding to −20 dB (left example), 0 dB (middle), and 20 dB (right example). The associated normalized firing rates can be looked up using the normalized rate-intensity function of Figure 1 (bottom panels).
FIG. 4
FIG. 4
Mean normalized firing rate of all fibers in the auditory nerve. The intensity scale is logarithmic on the left (level in dB) and linear on the right; the inset shows a magnified view of low intensities. The analytical solution given in Eq. 5 is represented by a solid curve; approximations for low and high intensities are shown as a dashed and a dotted curve, respectively. The mean rates for the three coarse examples of Figure 3 (with only 21 neurons) are shown as filled gray circles; the black dots were obtained for a refined numerical model with 1,000 neurons.
FIG. 5
FIG. 5
Averaging the mean normalized firing rates over nerve-fiber populations with different sensitivities. The intensity scale is logarithmic on the left (level in dB) and linear on the right; the inset shows a magnified view of low intensities. The leftmost curve in the left panel and the upper curve in the right panel are identical with the respective curves in Figure 4. Now, these curves are assumed to represent the most sensitive population of nerve fibers. Curves for less sensitive populations may be obtained by shifting, in the left panel, the curve for the most sensitive population to the right. In the present example, shifts between 2 and 20 dB were performed in steps of 2 dB. The fat dashed curve shows the mean rate of all populations (shifts in steps of 0.05 dB in this numerical calculation); the basically congruent solid curve represents the exact analytical solution according to Eq. 28. The thin dashed curve represents an approximation for intensities around 0 dB (Eq. 43). For other intensities, this approximation makes unrealistic predictions.
FIG. 6
FIG. 6
A As left panel of Figure 5, but for a finite rather than an infinite cochlea. The fat dashed curve shows again the numerically calculated mean normalized rate of all neural populations. At lower sound levels, this curve basically coincides with the analytical solution for an infinite cochlea (thick solid curve). The latter does not saturate at high levels, though. B By choosing different parameters, the mean normalized rate can be made to increase more slowly, resulting in a wider dynamic range.
FIG. 7
FIG. 7
Comparison of normalized response amplitudes. The intensity scale is logarithmic on the left (level in dB) and linear on the right; the inset shows a magnified view of low intensities. The normalized rate-intensity function of a single neuron is represented by a thin solid curve; the homogeneous auditory-nerve model (all fibers having the same sensitivity) is represented by a thick gray curve, the inhomogeneous auditory-nerve model (sensitivity distributed over a 20-dB range) is represented by a thick black curve. All these curves were normalized so that, in the low-intensity limit, response amplitude and normalized intensity are identical (dashed curve). The left panel also shows the high-intensity approximations for the two auditory-nerve models (dotted lines). In addition, the approximation given in Eq. 29 is shown as a dash-dotted curve.
FIG. 8
FIG. 8
The two auditory-nerve models from an experimenter’s point of view. At higher intensities, the response amplitude of either model increases linearly with sound level. A similar increase was observed in physiological studies. Thus, a data transformation based on this shared feature may help to compare data and model. Such a transformation is illustrated here for the two auditory-nerve models. The respective curves in the left panel of Figure 7 were transformed in such a way that they got the same high-intensity approximation (dotted line), with normalized response amplitudes of zero and one at 0 and 10 dB, respectively. Thus, 0 dB may be interpreted now as the threshold extrapolated from observations at higher intensities. By applying a corresponding transformation to real data, an experimenter may get an idea of the intensity range where a roughly proportional relationship between response amplitude and intensity (dashed curves) is to be expected. Such proportionality may be expected below −10 dB for the inhomogeneous auditory nerve model (black curve) and below −5 dB for the homogeneous auditory-nerve model (gray curve).
FIG. 9
FIG. 9
Higher threshold associated with faster growth (example). The intensity scale is logarithmic on the left (level in dB) and linear on the right; the inset shows a magnified view of low intensities. The thick solid curve corresponds to the solid curve in Figure 4 (ν = 4). The thin solid curve is identical, except that the sensitivity is reduced by 10 dB. The dashed curve demonstrates that such a reduction in sensitivity can be compensated for, at higher intensities, by a faster growth of the mean firing rate (dashed curve). The faster growth was achieved by assuming ν= 3. A reduction of the parameter v corresponds to a loss in sharpness of the cochlear excitation pattern.
FIG. 10
FIG. 10
Pseudo-linearity with respect to sound pressure. In contrast to Figure 8, the normalized response amplitude of the inhomogeneous auditory-nerve model (solid curve; high-intensity approximation represented by dotted curve) is shown as a function of normalized sound pressure. The corresponding dB value may be looked up in the upper scale. Up to a normalized sound pressure of about 2.5 (8 dB), the curve is close to the dashed line, which represents the tangent at a normalized level of −10 dB. Thus, noisy data may easily be misinterpreted as showing a linear dependence of the response amplitude on sound pressure. Extrapolation of this linear law would yield a threshold of about −18 dB (see magnified view in the inset).
FIG. 11
FIG. 11
Comparison between normalized response amplitude and loudness. As in the right panel of Figure 7, the normalized response amplitudes of the homogeneous and the inhomogeneous auditory-nerve model are shown as a thick gray and a thick black curve, respectively (inset providing magnified view of low intensities). Roughly in the middle between these two curves, the thick dashed curve is found, which represents a normalized version of Zwislocki’s (1965) loudness function. A similar function (thin black curve) is obtained by assuming that a real auditory nerve behaves like a hybrid of the above two model variants.
FIG. 12
FIG. 12
Simulation showing that the model is robust against minor deviations from the assumed linear relationship between logarithm of BM displacement and distance from characteristic location. A The thin curves correspond to the 50-dB curve in Figure 2A, except for horizontal shifts (in steps of 5 dB). The curves simulate data that deviate from an exact linear law. The thick lines show linear approximations to the thin curves, and they represent the model. The boundaries of the cochlear region accounted for are marked by dotted vertical lines. B The curves of A were transformed into normalized firing rates. C Mean normalized firing rate as a function of maximum BM displacement in dB. The thick curve represents the model; the thin curve the simulated data. The two curves show an excellent agreement, at least qualitatively.

Similar articles

Cited by

References

    1. Abramowitz M, Stegun IA. Handbook of Mathematical Functions Dover, New York, 1965.
    1. {'text': '', 'ref_index': 1, 'ids': [{'type': 'DOI', 'value': '10.1121/1.408182', 'is_inner': False, 'url': 'https://doi.org/10.1121/1.408182'}, {'type': 'PubMed', 'value': '8370887', 'is_inner': True, 'url': 'https://pubmed.ncbi.nlm.nih.gov/8370887/'}]}
    2. Allen JB, Fahey PF. A second cochlear-frequency map that correlates distortion product and neural tuning measurements. J. Acoust. Soc. Am. 94, 809–816, 1993. - PubMed
    1. None
    2. Antoli-Candela F, Kiang NY. Unit activity underlying the N1 potential. In: Naunton RF and Fernandez C (eds) Evoked Electrical Activity in The Auditory Nervous System. New York, Academic, pp. 165–191, 1978.
    1. {'text': '', 'ref_index': 1, 'ids': [{'type': 'DOI', 'value': '10.1007/s101620010084', 'is_inner': False, 'url': 'https://doi.org/10.1007/s101620010084'}, {'type': 'PMC', 'value': 'PMC3202402', 'is_inner': False, 'url': 'https://pmc.ncbi.nlm.nih.gov/articles/PMC3202402/'}, {'type': 'PubMed', 'value': '12162363', 'is_inner': True, 'url': 'https://pubmed.ncbi.nlm.nih.gov/12162363/'}]}
    2. Buus S, Florentine M. Growth of loudness in listeners with cochlear hearing losses: recruitment reconsidered. J. Assoc. Res. Otolaryngol. 3:120–39, 2002. - PMC - PubMed
    1. {'text': '', 'ref_index': 1, 'ids': [{'type': 'DOI', 'value': '10.1121/1.423295', 'is_inner': False, 'url': 'https://doi.org/10.1121/1.423295'}, {'type': 'PubMed', 'value': '9670532', 'is_inner': True, 'url': 'https://pubmed.ncbi.nlm.nih.gov/9670532/'}]}
    2. Buus S, Musch H, Florentine M. On loudness at threshold. J. Acoust. Soc. Am. 104:399–410, 1998. - PubMed

LinkOut - more resources