. 2007 Oct;54(10):2091-101.
doi: 10.1109/tuffc.2007.504.

High speed imaging of bubble clouds generated in pulsed ultrasound cavitational therapy--histotripsy

Affiliations

High speed imaging of bubble clouds generated in pulsed ultrasound cavitational therapy--histotripsy

Zhen Xu et al. IEEE Trans Ultrason Ferroelectr Freq Control. 2007 Oct.

Abstract

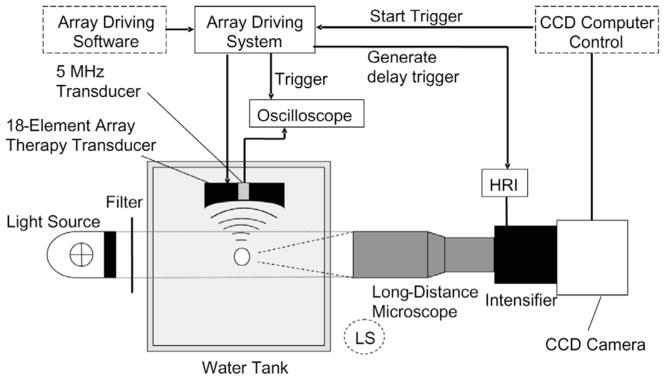
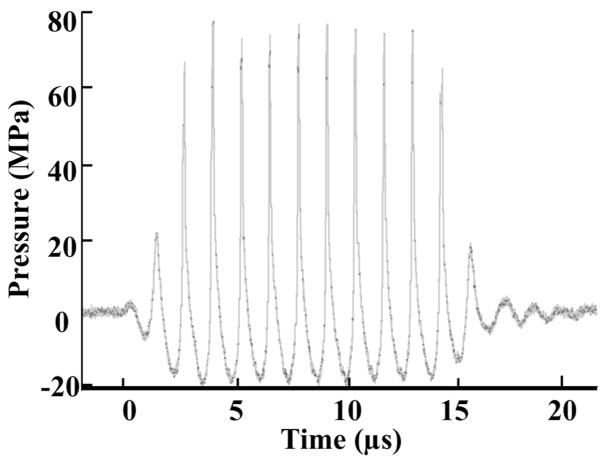
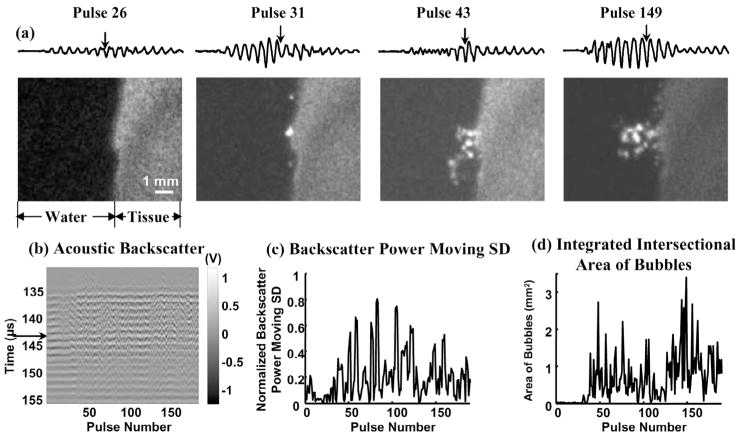
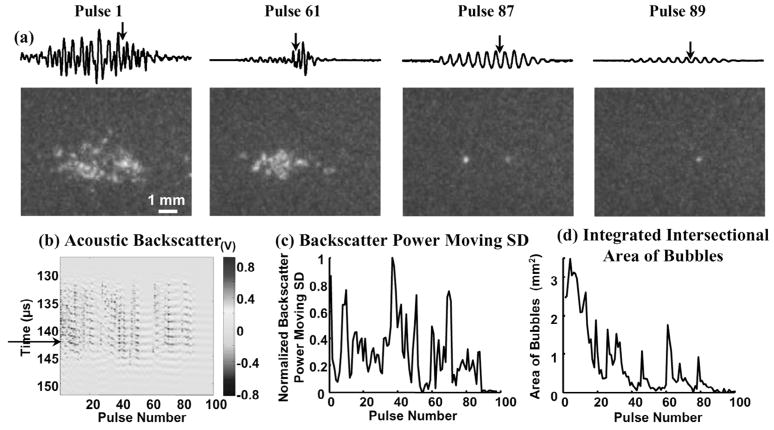
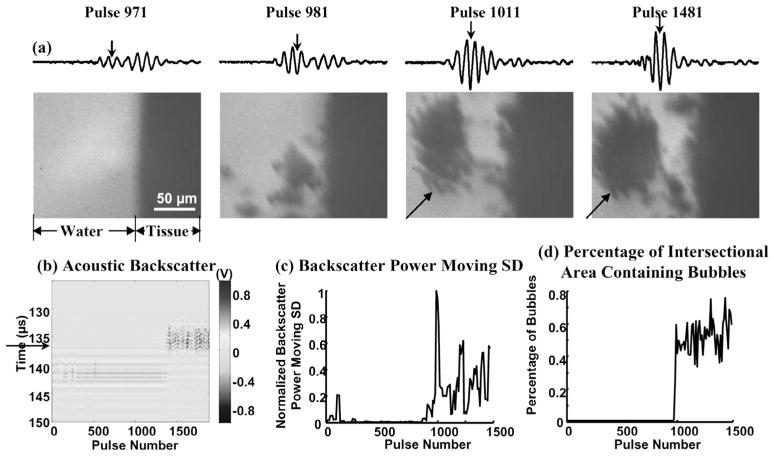
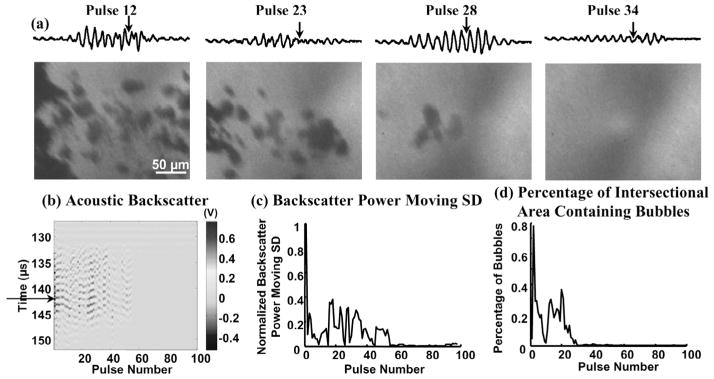
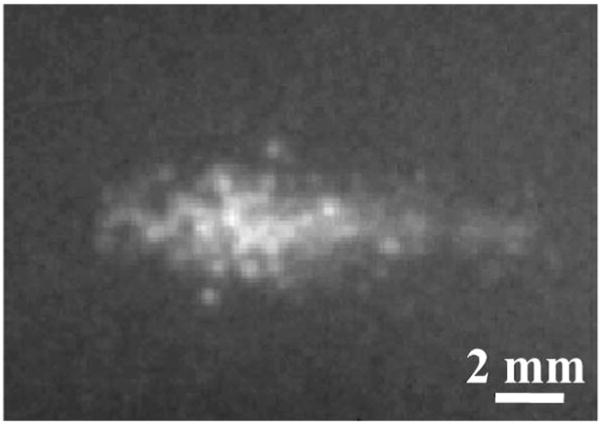
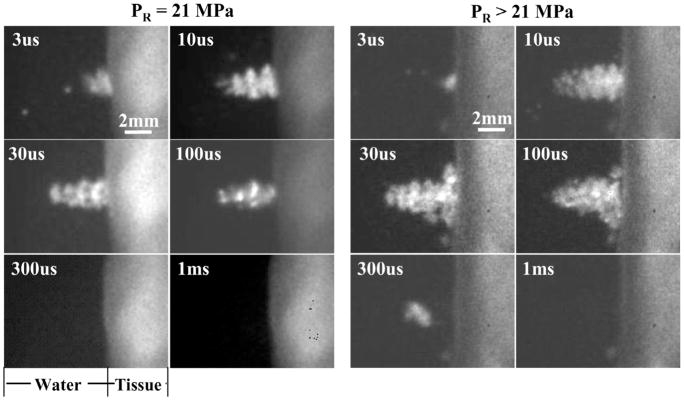
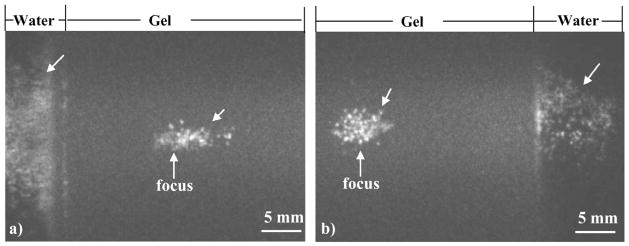
Our recent studies have demonstrated that mechanical fractionation of tissue structure with sharply demarcated boundaries can be achieved using short (< 20 micros), high intensity ultrasound pulses delivered at low duty cycles. We have called this technique histotripsy. Histotripsy has potential clinical applications where noninvasive tissue fractionation and/or tissue removal are desired. The primary mechanism of histotripsy is thought to be acoustic cavitation, which is supported by a temporally changing acoustic backscatter observed during the histotripsy process. In this paper, a fast-gated digital camera was used to image the hypothesized cavitating bubble cloud generated by histotripsy pulses. The bubble cloud was produced at a tissue-water interface and inside an optically transparent gelatin phantom which mimics bulk tissue. The imaging shows the following: (1) Initiation of a temporally changing acoustic backscatter was due to the formation of a bubble cloud; (2) The pressure threshold to generate a bubble cloud was lower at a tissue-fluid interface than inside bulk tissue; and (3) at higher pulse pressure, the bubble cloud lasted longer and grew larger. The results add further support to the hypothesis that the histotripsy process is due to a cavitating bubble cloud and may provide insight into the sharp boundaries of histotripsy lesions.


Figures

Fig. 1
Fig. 1
Schematic drawing of experimental setup for high speed imaging and acoustic backscatter recording. The light source position shown was for bubble shadowgraph acquisition. For whole bubble cloud imaging with forward lighting, the long-distance microscope was replaced by lenses described in the methods section and the light source was moved to the position labeled as “LS” (dashed circle).
Fig. 2
Fig. 2
Acoustic pressure waveform of a 10-cycle (14-μs) histotripsy pulse in water at the transducer focus (PR = 21 MPa, PC = 76 MPa).
Fig. 3
Fig. 3
(a) Waveforms of the 25-μs-long range-gated acoustic backscatter signals (top) and the corresponding bubble cloud images (bottom) produced at a tissue-water interface. The x- and y-axes for the acoustic backscatter waveform are the same as the y-axis and the voltage scale in (b). (b) Acoustic backscatter signals in slow-time and fast-time display. Each vertical line is a range-gated voltage trace where voltage is encoded in gray scale. (c) Normalized backscatter power SD as a function of pulse number. (d) Integrated intersectional area of bubbles as a function of pulse number. Formation of the bubble cloud corresponded to the initiation of the variable acoustic backscatter. Arrows on the acoustic backscatter trace in (a) and acoustic backscatter fast-time and slow-time image in (b) indicate when the optical image was taken. Acoustic parameters used in all of the figures are listed in Table I.
Fig. 4
Fig. 4
(a) Waveforms of the range-gated acoustic backscatter signals (top) and the corresponding bubble cloud images (bottom) produced inside a gelatin phantom. (b) Acoustic backscatter signals, (c) backscatter power moving SD, and (d) integrated intersectional area of bubbles displayed in the same format as Fig. 3(b)–(d). Arrows on the acoustic backscatter trace in (a) and acoustic backscatter fast-time and slow-time image in (b) indicate when the optical image was taken. The disappearance of the bubble cloud and the extinction of acoustic backscatter corresponded in time. A residual bubble appeared to remain static in the gel long after the bubble cloud disappeared (hundreds of ms).
Fig. 5
Fig. 5
(a) Waveforms of the range-gated acoustic backscatter signals (top) and the corresponding bubble shadowgraphs (bottom) produced at a tissue-water interface. (b) Acoustic backscatter signals and (c) backscatter power moving SD displayed in the same format as Fig. 3(b)–(c). (d) Percentage of intersectional area containing bubbles as a function of pulse number. Arrows on the acoustic backscatter trace in (a) and acoustic backscatter fast-time and slow-time image in (b) indicate when the optical image was taken. Both the variable acoustic backscatter and bubbles appeared at the 981st pulse. Bubble aggregations were often observed (indicated by arrows in the two rightmost shadowgraphs).
Fig. 6
Fig. 6
(a) Waveforms of the range-gated acoustic backscatter signals (top) and the corresponding bubble shadowgraphs (bottom) produced inside a gelatin phantom. (b) Acoustic backscatter signals, (c) backscatter power moving SD, and (d) percentage of intersectional area containing bubbles displayed in the same format as Fig. 5(b)–(d). Arrows on the acoustic backscatter trace in (a) and acoustic backscatter fast-time and slow-time image in (b) indicate when the optical image was taken. The disappearance of bubbles and the extinction of the variable acoustic backscatter were observed.
Fig. 7
Fig. 7
A summed image (over 40 snapshots) of the bubble cloud generated inside a gelatin phantom shows the cigar shape of the cloud.
Fig. 8
Fig. 8
Images of bubble clouds generated by a 10-cycle (14-μs) pulse at PR of 21 MPa (left) and >21 MPa (right) at a tissue-water interface. Each image was taken at a specific time delay (labeled) after the arrival of the histotripsy pulse at the transducer focus (i.e., tissue surface). The bubble cloud was larger and longer in duration at higher PR.
Fig. 9
Fig. 9
Images of bubble clouds generated inside a gelatin phantom and at a gel-water interface (indicated by arrows). When focusing inside the gelatin phantom, one bubble cloud was generated in the gel at the transducer focus, and another was generated at the gel-water interface ~1 cm pre-focus (a) and post-focus (b). However, no bubbles were generated in between, where the pressure exceeded that at the gel-water interface. The ultrasound was propagated from left to right in both images.

Similar articles

Cited by

References

    1. Fry FJ, Kossoff G, Eggleton RC, Dunn F. Threshold ultrasound dosages for structural changes in the mammalian brain. J Acoust Soc Amer. 1970;48:1413–1417. - PubMed
    1. Dunn F, Fry FJ. Ultrasonic threshold dosages for the mammalian central nervous system. IEEE Trans Biomed Eng. 1971;18:253–256. - PubMed
    1. Frizzell LA, Lee CS, Aschenbach PD, Borrelli MJ, Morimoto RS, Dunn F. Involvement of ultrasonically induced cavitation in hind limb paralysis of the mouse neonate. J Acoust Soc Amer. 1983;74:1062–1065. - PubMed
    1. ter Haar GR, Daniels S, Morton K. Evidence for acoustic cavitation in vivo: Threshold for bubble formation with 0.75-MHz continuous-wave and pulsed beam. IEEE Trans Ultrason, Ferroelect, Freq Contr. 1986;33:162–164. - PubMed
    1. Hynynen K. Threshold for thermally significant cavitation in dog’s thigh muscle in vivo. Ultrasound Med Biol. 1991;17:157–169. - PubMed

Publication types

MeSH terms