. 2007;2(3):389-406.

Connective tissue progenitor cell growth characteristics on textured substrates

Affiliations

Connective tissue progenitor cell growth characteristics on textured substrates

Alvaro Mata et al. Int J Nanomedicine. 2007.

Abstract

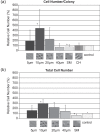
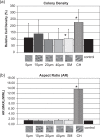
Growth characteristics of human connective tissue progenitor (CTP) cells were investigated on smooth and textured substrates, which were produced using MEMS (microelectromechanical systems) fabrication technology. Human bone marrow derived cells were cultured for 9 days under conditions promoting osteoblastic differentiation on polydimethylsiloxane (PDMS) substrates comprising smooth (non-patterned) surfaces (SMOOTH), 4 different cylindrical post micro-textures (POSTS) that were 7-10 microm high and 5, 10, 20, and 40 microm diameter, respectively, and channel micro-textures (CHANNELS) with curved cross-sections that were 11 microm high, 45 microm wide, and separated by 5 microm wide ridges. Standard glass-tissue culture surfaces were used as controls. Micro-textures resulted in the modification of CTP morphology, attachment, migration, and proliferation characteristics. Specifically, cells on POSTS exhibited more contoured morphology with closely packed cytoskeletal actin microfilaments compared to the more random orientation in cells grown on SMOOTH. CTP colonies on 10 gm-diameter POSTS exhibited higher cell number than any other POSTS, and a significant increase in cell number (442%) compared to colonies on SMOOTH (71%). On CHANNELS, colonies tended to be denser (229%) than on POSTS (up to 140% on 10 microm POSTS), and significantly more so compared to those on SMOOTH (104%).


Figures

Figure 1
Figure 1
Fabrication of micro-textured POSTS (ad) and CHANNELS (eh) polydimethylsiloxane (PDMS) substrates by Soft Lithography. The cross-sectional schematic diagrams for POSTS depict: (a) starting substrate, which is a 100 mm-diameter, (100)-oriented silicon (Si) wafer; (b) patterned Si master, which has been processed by microfabrication and micromachining techniques and coated with a fluorinated alkyltrichlorosilane (R-SiCl3) to facilitate mold release; (c) molding of PDMS by casting; and (d) release of PDMS cast from Si master. The cross-sectional schematic diagrams for CHANNELS depict: (e) starting substrate, which is a 100 mm-diameter, (100)-oriented Si wafer; (f) thick photoresist coating patterned by photolithography, and rounding of pattern edges due to reflow of photoresist during baking; (g) molding of PDMS by casting onto patterned master after coating with a fluorinated R-SiCl3 to facilitate mold release; and (h) release of PDMS cast from master.
Figure 2
Figure 2
Schematic diagrams depicting: (a) a single colony of cells and colony parameters: longest axis of the colony (MAXL), shortest axis of the colony (MINL), and colony aspect ratio (AR); and (b) a pair of channels illustrating alignment of cells with respect to channel axis.
Figure 3
Figure 3
Photograph showing setup for time-lapse microscopy including the microscope (with fluorescent and phase contrast modes), an incubator, a camera for imaging of the cultures at specific times, and a computer for storage and display.
Figure 4
Figure 4
Scanning electron microscope (SEM) images of POSTS that are 7–10 μm high, (a) 5 μm, (b) 10 μm, (c) 20 μm, and (d) 40 μm diameter, with the same separation distance between the posts; (e) CHANNELS that are 11 μm high and 45 μm wide; and (f) SMOOTH substrates.
Figure 5
Figure 5
Images illustrate differences in colony (fluorescent microscope) and cell (SEM) morphology after fixation and staining. (a) On SMOOTH, colonies were approximately circular in shape and cells exhibited a broad flattened shape; (b) on POSTS, colonies were larger and cells exhibited narrower elongated processes; and (c) on CHANNELS, both colonies and cells were highly aligned along the channel axis.
Figure 6
Figure 6
SEM images illustrate: (a) cells growing on 10 μm POSTS with long processes (white arrows and inset) directed towards posts and other cells; and (b) a closer view demonstrating cells with highly contoured morphologies and processes directed towards posts and their neighboring cells.
Figure 7
Figure 7
Phase contrast (a) and SEM (b) images of cells on 5 μm POSTS. Cells tended to grow in an orthogonal manner between and along the array of posts, which form an equivalent channel-like texture.
Figure 8
Figure 8
Cells on CHANNELS aligned along the direction of the channels (black arrows), while cells on SMOOTH kept their random orientation (white arrows) (a). The majority of cells aligned within the channels (b). while a few straddled the ridges (c). In some cases, distortions of the ridges at the points of cell attachment were observed (dashed black arrows), which suggest strong adhesion of the cell to PDMS (d). Phase contrast image is (a); (b)–(d) are SEM images.
Figure 9
Figure 9
Fluorescent microscope images depict: (a) actin cytoskeleton aligned along the axis of the CHANNELS; and (b) actin cytoskeleton exhibiting random orientation on SMOOTH.
Figure 10
Figure 10
Fluorescent microscope images of cells grown on 10 μm POSTS showing: (a) focal adhesion contacts (spots marked by white arrows) and cell nuclei; and (b) actin cytoskeleton and cell nuclei.
Figure 11
Figure 11
Quantification of height from the bottom of the lowest observed actin microfilaments to the bottom of the nucleus (lighter tone striped bars on left), and from the lowest actin to the top of the nucleus (darker tone solid bars on right). The difference between the two bars for each substrate corresponds to the cell nucleus height. N corresponds to the number of cells measured on each substrate. There was a statistically significant difference between the 10 μm POSTS and the SMOOTH for both bars (p < 0.05).
Figure 12
Figure 12
Time-lapse microscopy images showing a cell (white arrow) at the edge of a growing colony near the interface of 10 μm POSTS and SMOOTH (a), reaching the smooth regions (b), and as it migrates on SMOOTH (c), it attaches to the posts (df) and migrates back towards POSTS (g, h). Time scale is 10 hours. (Note: the brighter, irregular circular shapes visible between and above posts represent erythrocytes and other cells present in the bone marrow aspirate).
Figure 13
Figure 13
Phase contrast (a) and fluorescent microscope (b) images illustrating a colony of cells (stained with DAPI) demonstrating preference for 10 μm POSTS while avoiding SMOOTH.
Figure 14
Figure 14
Time-lapse microscopy images showing transfected cells grown on 10 μm POSTS. Notice the fluorescent actin cytoskeleton (white arrow) attaching to a post (white circle drawn for clarity) (a); detaching from the post as it begins to migrate (b); and finally release from the post (c). Time scale is 15 minutes.
Figure 15
Figure 15
Time-lapse microscopy images depicting a cell (white arrow) at the interface between CHANNELS and SMOOTH. The cell spreads perpendicular to the channels (a, b), attaches to the ridge of a channel (c), and migrates into the channel while aligning its body along the channel axis (df). Time scale is 4 hours. Note: the circular shapes visible in the channels represent erythrocytes and other cells present in the bone marrow aspirate.
Figure 16
Figure 16
Graphs showing quantification of cell number/colony (a) and total cell number (b) from five fields of vision. Both graphs reveal a similar trend with POSTS exhibiting higher number of cells, with the highest number on 10 μm POSTS (* denotes statistical significance: p < 0.05).
Figure 17
Figure 17
Graphs showing quantification of cell density (cell number/colony area) (a) and colony aspect ratio (AR = MAXL/MINL) (b) on CHANNELS (*denotes statistical significance: p < 0.05).

References

    1. Bone grafting CHC medical library and patient education 1999Bone grafts and bone substitutes Orthopedic Network News 1010–17.2003. Synthetic bone graft to be tested in revision hip surgery, Bioportfolio; (2005). Bone grafting, The Cleveland Clinic.
    1. Alaerts JA, De Cupere VM, et al. Surface characterization of poly(methyl methacrylate) microgrooved for contact guidance of mammalian cells. Biomaterials. 2001;22(12):1635–42. - PubMed
    1. Bauer TW, Muschler GF. Bone graft materials. An overview of the basic science. Clinical Orthopaedics and Related Research. 2000;371:10–27. - PubMed
    1. Brunette DM. Fibroblasts on micromachined substrata orient hierarchically to grooves of different dimensions. Experimental Cell Research. 1986;164(1):11–26. - PubMed
    1. Brunette DM. Spreading and orientation of epithelial cells on grooved substrata. Experimental Cell Research. 1986;167(1):203–17. - PubMed

Publication types

MeSH terms