. 2007 Dec;40(6):921-35.
doi: 10.1111/j.1365-2184.2007.00471.x.

Oestrogen mediates the growth of human thyroid carcinoma cells via an oestrogen receptor-ERK pathway

Affiliations

Oestrogen mediates the growth of human thyroid carcinoma cells via an oestrogen receptor-ERK pathway

Q Zeng et al. Cell Prolif. 2007 Dec.

Abstract

Objectives: Although thyroid cancer occurs much more frequently in females, the role of sex hormones in thyroid carcinogenesis is unknown. In this study, it has been investigated how 17beta-oestradiol (E2) influenced proliferation and growth of thyroid cancer cells.

Materials and methods: Cell proliferation and its related molecules were examined in thyroid papillary carcinoma cells (KAT5), follicular thyroid carcinoma cells (FRO) and anaplastic carcinoma cells (ARO). Levels of oestrogen receptor (ER) alpha and beta were regulated by their agonists (PPT and DPN), antagonists and siRNA.

Results: E2 promoted cell proliferation. Such an effect was positively related to ERalpha but negatively to ERbeta; PPT enhanced cell proliferation while DPN inhibited it. PPT increased Bcl-2 expression while DPN decreased it. DPN also elevated Bax expression. PPT elevated the level of phosphorylated extracellular signal-regulated kinase 1/2 (pERK1/2), suggesting a positive role of ERK1/2 in E2-induced cell proliferation. Knockdown of ERalpha significantly attenuated E2-mediated Bcl-2 and pERK1/2 expression. In contrast, knockdown of ERbeta markedly enhanced them.

Conclusions: Oestrogen stimulates proliferation of thyroid cancer cells, associated with increase in Bcl-2 and decrease in Bax levels in an ERK1/2-related pathway. Imbalance between ERalpha and ERbeta may contribute to thyroid carcinogenesis.


Figures

Figure 1
Figure 1
Cell proliferation. Thyroid cancer cells were treated with E2 (a), PPT (b), DPN (c) and E2 + ICI or E2 + MPP (d), and cell proliferation was measured by MTT assay. Compared to untreated samples, there was significant increase in cells at 48 h of treatment with 10−7 M, 10−8 M, 10−9 M, 10−10 M of E2 (all *P < 0.05) and the increase continued with 100 nm of E2 at 72 h (*P < 0.05) (a). The increase was inhibited by addition of MPP (10−6 M) and ICI (10−6 M) at 48 h after treatment (d). Cell proliferation was significantly elevated at 48 h after PPT (10−6 M) treatment (*P < 0.05) (b). An obvious decrease in cell proliferation occurred in cells treated with DPN at 48 h (c). Results of the MTT assay were confirmed by BrdU cell proliferation assay (e, f and g). Data are the mean ± SD of four separate experiments.
Figure 2
Figure 2
Measurement of apoptosis. After treatment with 10−6 M of DPN, DNA apoptotic bodies were detected using a DNA fragmentation ELISA kit (a). DNA fragmentation gradually increased and reached significance at 48 h after 10−6 DPN treatment, compared to untreated cells, *P < 0.01, n = 3. In addition to the DNA fragmentation assay, apoptotic cells were also detected using annexin V and propidium iodide staining (b). After 10−6 DPN treatment, viable, apoptotic and necrotic cells were determined. The percentage of apoptotic cells gradually increased and reached significance at 48 h after the treatment, compared to untreated cells, *P < 0.01, n = 3 (c). Results shown are representative of three independent experiments.
Figure 3
Figure 3
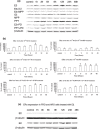
The expression of ERα protein in response to E2, 1PPT, E2 + MPP, 1E2 + ICI, E2 + PD and PPT + PD. Levels of ERα protein (67 kDa) in treated KAT5 cells were investigated by Western blot analysis and representative results of the independent experiments are shown (a). Densities of protein bands were determined and the average level is provided (b). A significant increase was observed in cells treated with E2 or E2 + PD from 3 h to 24 h and in cells treated with PPT from 9 h to 48 h or PPT + PD from 6 h to 24 h, compared to untreated cells, *P < 0.01, n = 3. E2 also slightly stimulated expression of ERα in FRO and ARO cells after treatment for 12 h or longer (c).
Figure 4
Figure 4
Expression of ERβ in response to E2 and DPN. Levels of ERβ protein (57 kDa) in KAT5 cells treated with E2 and DPN were determined by Western blot analysis. Representative results of the independent experiments are shown (a). Densities of protein bands were determined and the average level is provided (b). A significant increase in the level ERβ was observed in KAT5 cells treated with DPN from 12 h to 48 h, compared to untreated cells, *P < 0.05, n = 3. Both E2 and DPN significantly enhanced the level of ERβ in FRO cells but had no obvious effect on its expression in ARO cells (c).
Figure 5
Figure 5
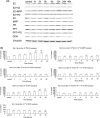
Expression of Bcl‐2 in response to E2 and its related agents. Levels of Bcl‐2 protein (28 kDa) in KAT5 cells treated with E2 and its related agents were investigated by Western blot analysis. Representative results of independent experiments are shown (a). Densities of protein bands were determined and the average level is provided (b). Compared to untreated cells, a significant increase was observed in cells treated with E2 from 9 h to 24 h, and with 10−6 M PPT from 12 h to 48 h (all *P < 0.05, n = 3). In contrast, a significant decrease in the expression of Bcl‐2 was observed in cells treated with 10−6 M DPN from 24 h to 48 h, *P < 0.05, n = 3.
Figure 6
Figure 6
Expression of Bax in response to E2, PPT and DPN. Levels of Bax protein (23 kDa) in KAT5 cells treated with E2, PPT and DPN were investigated by Western blot analysis. Representative results of three independent experiments are shown (a). Densities of protein bands were determined and average level provided (b). Compared to untreated cells, a significant increase in Bax expression was observed in cells treated with DPN from 9 h to 24 h, *P < 0.05, n = 3.
Figure 7
Figure 7
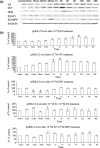
Expression of phosphorylated ERK1/2 in response to 10−8 M E2 and its related agents. Levels of pERK1/2 protein (42/44 kDa) in cells treated with E2 and its related agents were investigated by Western blot analysis. Representative results of independent experiments on KAT5 cells are shown (a). Densities of protein bands were determined and the average level provided (b). Compared to untreated cells, a significant increase of pERK1/2 was observed in cells treated with E2 at 12 h, and with PPT at 1 h and 3 h (all *P < 0.01, n = 3). However, a significant decrease was observed in cells treated with DPN at 15min and 30min (*P < 0.01, n = 3). Administration of either MPP or ICI prevented the effect of E2 on pERK1/2 protein expression. Besides, total ERK1/2 expression had no difference between E2 and its related agents in KAT5 cells (c). In ARO cells, both E2 and DPN could enhance pERK1/2 at 5–35 min after the treatment (d) and thereafter the level of pERK1/2 gradually returned to a level closed to control. No similar effect was observed in FRO cells (d).
Figure 7
Figure 7
Expression of phosphorylated ERK1/2 in response to 10−8 M E2 and its related agents. Levels of pERK1/2 protein (42/44 kDa) in cells treated with E2 and its related agents were investigated by Western blot analysis. Representative results of independent experiments on KAT5 cells are shown (a). Densities of protein bands were determined and the average level provided (b). Compared to untreated cells, a significant increase of pERK1/2 was observed in cells treated with E2 at 12 h, and with PPT at 1 h and 3 h (all *P < 0.01, n = 3). However, a significant decrease was observed in cells treated with DPN at 15min and 30min (*P < 0.01, n = 3). Administration of either MPP or ICI prevented the effect of E2 on pERK1/2 protein expression. Besides, total ERK1/2 expression had no difference between E2 and its related agents in KAT5 cells (c). In ARO cells, both E2 and DPN could enhance pERK1/2 at 5–35 min after the treatment (d) and thereafter the level of pERK1/2 gradually returned to a level closed to control. No similar effect was observed in FRO cells (d).
Figure 8
Figure 8
Block of ERα and ERβ by siRNAs. Following transfection of siRNA directed towards ERα and ERβ for 24 h, cells were treated with either E2 or vehicle alone for 24 h. Proteins were isolated from the cells and were subjected to Western blot analysis for both ERα and ERβ. Densities of protein bands were measured. Both ERα and ERβ could be significantly inhibited by 25 or 50 nm siRNA after 24 h treatment (a). Levels of Bcl‐2 and pERK1/2 were measured after knockdown of ERα or ERβ (b). Data are the mean of three independent experiments,*P < 0.05, n = 3.

References

    1. Acconcia F, Totta P, Ogawa S, Cardillo I, Inoue S, Leone S, Trentalance A, Muramatsu M, Marino M (2005) Survival versus apoptotic 17beta‐estradiol effect: role of ER alpha and ER beta activated non‐genomic signaling. J. Cell. Physiol. 203, 193–201. - PubMed
    1. Alexaki VI, Charalampopoulos I, Kampa M, Nifli AP, Hatzoglou A, Gravanis A, Castanas E (2006) Activation of membrane estrogen receptors induce pro‐survival kinases. J. Steroid Biochem. Mol. Biol. 98, 97–110. - PubMed
    1. Chen GG, Liu ZM, Vlantis AC, Tse GM, Leung BC, Van Hasselt CA (2004) Heme oxygenase‐1 protects against apoptosis induced by tumor necrosis factor‐alpha and cycloheximide in papillary thyroid carcinoma cells. J. Cell. Biochem. 92, 1246–1256. - PubMed
    1. Choi IJ, Kim JS, Kim JM, Jung HC, Song IS (2003) Effect of inhibition of extracellular signal‐regulated kinase 1 and 2 pathway on apoptosis and bcl‐2 expression in Helicobacter pylori‐infected AGS cells. Infect Immun 71, 830–837. - PMC - PubMed
    1. Clarke RB (2003) Steroid receptors and proliferation in the human breast. Steroids 68, 789–794. - PubMed

Publication types

MeSH terms