. 2007;8(11):R242.
doi: 10.1186/gb-2007-8-11-r242.

Quantification of ortholog losses in insects and vertebrates

Affiliations

Quantification of ortholog losses in insects and vertebrates

Stefan Wyder et al. Genome Biol. 2007.

Abstract

Background: The increasing number of sequenced insect and vertebrate genomes of variable divergence enables refined comparative analyses to quantify the major modes of animal genome evolution and allows tracing of gene genealogy (orthology) and pinpointing of gene extinctions (losses), which can reveal lineage-specific traits.

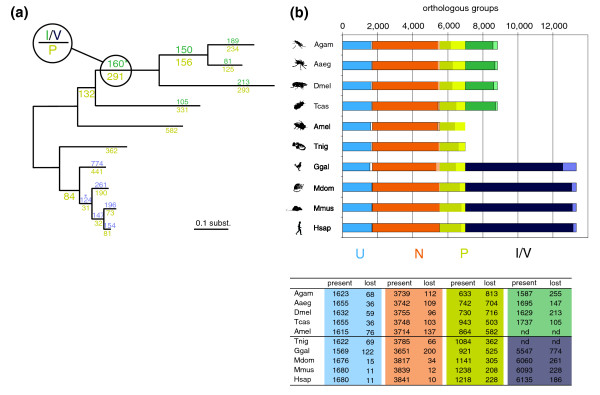
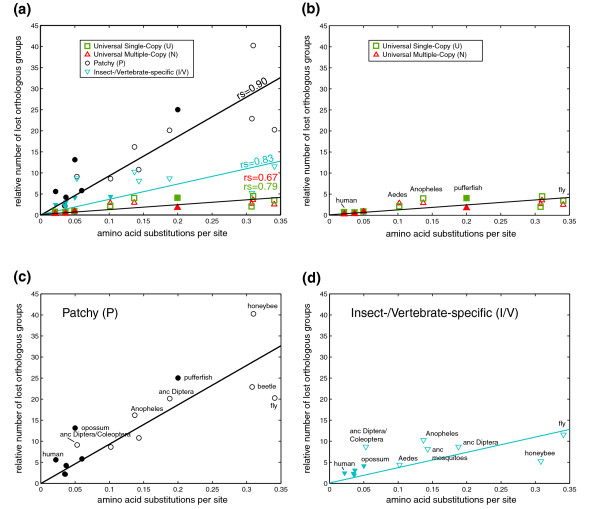
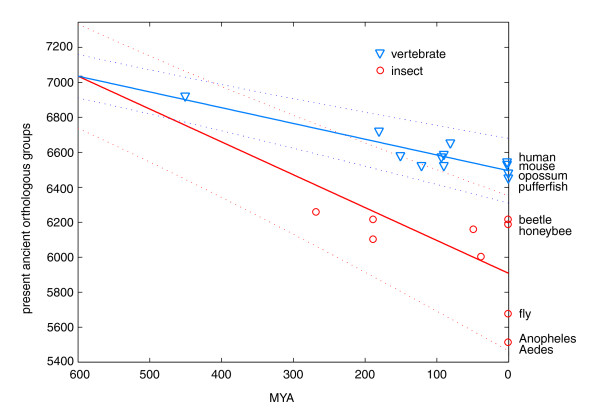
Results: To consistently quantify losses of orthologous groups of genes, we compared the gene repertoires of five vertebrates and five insects, including honeybee and Tribolium beetle, that represent insect orders outside the previously sequenced Diptera. We found hundreds of lost Urbilateria genes in each of the lineages and assessed their phylogenetic origin. The rate of losses correlates well with the species' rates of molecular evolution and radiation times, without distinction between insects and vertebrates, indicating their stochastic nature. Remarkably, this extends to the universal single-copy orthologs, losses of dozens of which have been tolerated in each species. Nevertheless, the propensity for loss differs substantially among genes, where roughly 20% of the orthologs have an 8-fold higher chance of becoming extinct. Extrapolation of our data also suggests that the Urbilateria genome contained more than 7,000 genes.

Conclusion: Our results indicate that the seemingly higher number of observed gene losses in insects can be explained by their two- to three-fold higher evolutionary rate. Despite the profound effect of many losses on cellular machinery, overall, they seem to be guided by neutral evolution.


Figures

Figure 1
Figure 1
Quantification of orthologous gene losses in insects and vertebrates. (a) The phylogenetic relations among the organisms are illustrated by the tree, with branch length proportional to the rate of amino acid substitutions estimated using the maximum-likelihood approach. The number of orthologous groups lost on the internal phylogenetic branches were inferred using the Dollo parsimony principle and are shown on the phylogenetic tree above branches for the I/V fraction, and below branches for the P fraction. *The presence in two species was sufficient to infer losses of I/V orthologous groups. (b) The number of orthologous group losses in the five main categories: U, universal single-copy genes (blue, present in all species except the one in question); N, universal multiple-copy genes (orange, present in at least nine species); P, patchy orthologs (yellow, present in both phyla in at least three species, in one or multiple copies); I/V, insect- or vertebrate-specific orthologous groups (present only in insects (green) or vertebrates (violet), in at least three species. The dark parts of the bars depict the number of contemporarily present orthologous groups, and the light parts depict the number of inferred losses. AGAM, Anopheles gambiae; AAEG, Aedes aegypti; DMEL, Drosophila melanogaster; TCAS, Tribolium castaneum; AMEL, Apis meliferia; HSAP, Homo sapiens; MMUS, Mus musculus; MDOM, Monodelphis domestica; GGAL, Gallus gallus; TNIG, Tetraodon nigroviridis.
Figure 2
Figure 2
The number of ortholog losses correlates with the rate of amino acid substitutions. The number of orthologous group (U, N, P, I/V) losses normalized with the total size of the fraction is plotted versus the branch length of the maximum-likelihood phylogenetic tree (Figure 1). (a) All ortholog types combined; (b) U and N orthologs; (c) Patchy orthologs; (d) Insect- and vertebrate-specific orthologs. Filled symbols denote vertebrates and open symbols denote insects. Spearman rank correlations: U orthologs, rs = 0.79, p = 0.015; N orthologs, rs = 0.67, p = 0.05; P orthologs, rs = 0.90, p < 0.01; I/V orthologs, rs = 0.83, p < 0.01. Regression slopes for U and N are not statistically different. Anc, ancestral.
Figure 3
Figure 3
Extrapolation of number of ancient (U, N and P) orthologs to Urbilateria. The regression lines (and their 90% confidence intervals) are drawn using the number of U, N and P orthologous groups in current species, the estimates for putative ancestors, including the inferred number of losses (Figure 1), and the assumed split of insects and vertebrates about 600 MYA against the species radiation time. Remarkably, the naïve counting of orthologous groups that have at least one insect and at least one vertebrate member results in 7,114 likely Urbilateria genes.
Figure 4
Figure 4
Expression pattern of the F-box gene during embryogenesis of the beetle T. castaneum. (a) F-box gene TC_04309 is initially expressed in the germ rudiment at the rims of the invaginating mesoderm, a position where activated Map-kinase is also seen [76]. Expression is strongest in the posterior (white arrow) and weakens towards the anterior. Ventral view, anterior is up posterior points down. Hl, head lobes. (b) Expression is seen as spots in the thoracic legs (arrowhead), at the base of the labral head appendages (small arrow head) and in segmentally repeated spots in the lateral body wall. T3, thoracic segment 3. Only the anterior half of the embryo is shown. (c) At a similar stage as shown in (b) where all body segments are present, the F-box gene is expressed in the anlagen of the hindgut (arrow). (d) When the legs have grown longer, F-box gene expression is extended covering the distal end. As seen in (c, d), expression in the labrum, in the hindgut-primordium and weakly at the lateral sites of the abdominal segments persists. (e) The hindgut has invaginated and grows out, forming a tube where the F-box gene is expressed in its posterior, proximal end around the future posterior gut opening (arrow). (f) At the retracted germ band stage, F-box is expressed around the anterior gut opening (white arrow) that has formed between the head lobes. (g) In the same embryo shown in (f), F-box gene expression is seen in the walls of the hindgut (arrow).

References

    1. Samonte RV, Eichler EE. Segmental duplications and the evolution of the primate genome. Nat Rev Genet. 2002;3:65–72. doi: 10.1038/nrg705. - DOI - PubMed
    1. Zhang J. Evolution by gene duplication: an update. Trends Ecol Evol. 2003;18:292–298. doi: 10.1016/S0169-5347(03)00033-8. - DOI
    1. Brosius J. RNAs from all categories generate retrosequences that may be exapted as novel genes or regulatory elements. Gene. 1999;238:115–134. doi: 10.1016/S0378-1119(99)00227-9. - DOI - PubMed
    1. Niimura Y, Nei M. Evolutionary dynamics of olfactory and other chemosensory receptor genes in vertebrates. J Human Genet. 2006;51:505–517. doi: 10.1007/s10038-006-0391-8. - DOI - PMC - PubMed
    1. Gilad Y, Wiebe V, Przeworski M, Lancet D, Paabo S. Loss of olfactory receptor genes coincides with the acquisition of full trichromatic vision in primates. PLoS Biol. 2004;2:E5. doi: 10.1371/journal.pbio.0020005. - DOI - PMC - PubMed

Publication types

LinkOut - more resources