. 2007 Dec 4;17(23):2035-40.
doi: 10.1016/j.cub.2007.10.059. Epub 2007 Nov 20.

Optic flow drives human visuo-locomotor adaptation

Affiliations

Optic flow drives human visuo-locomotor adaptation

Hugo Bruggeman et al. Curr Biol. .

Abstract

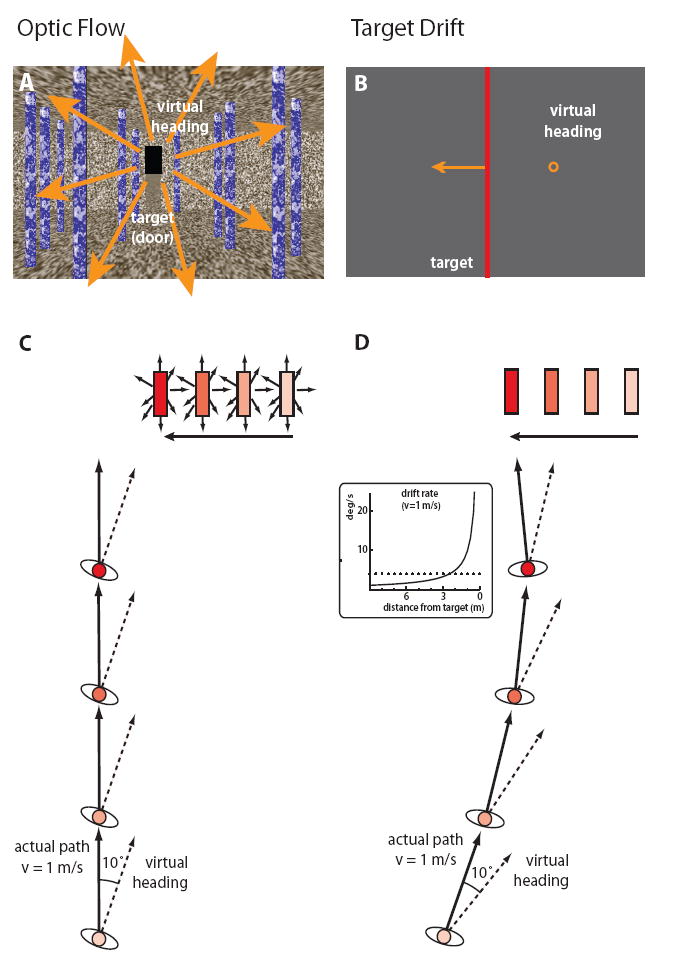
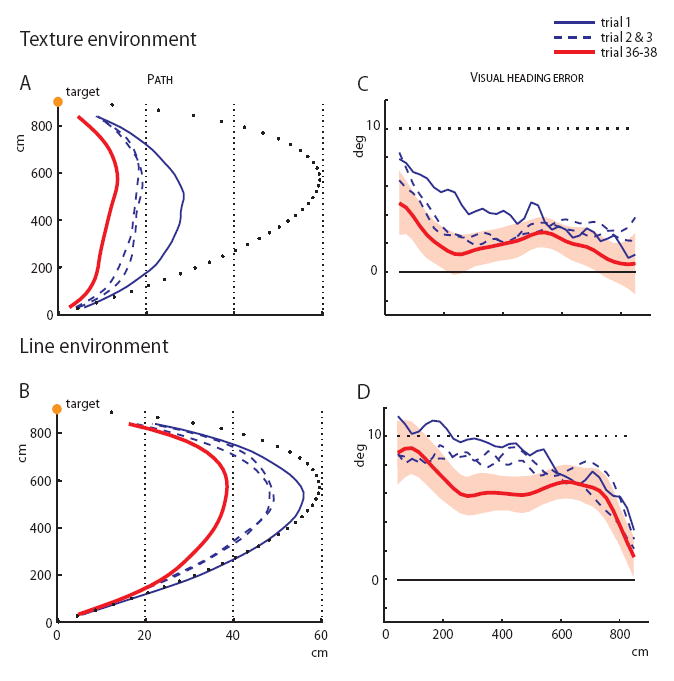
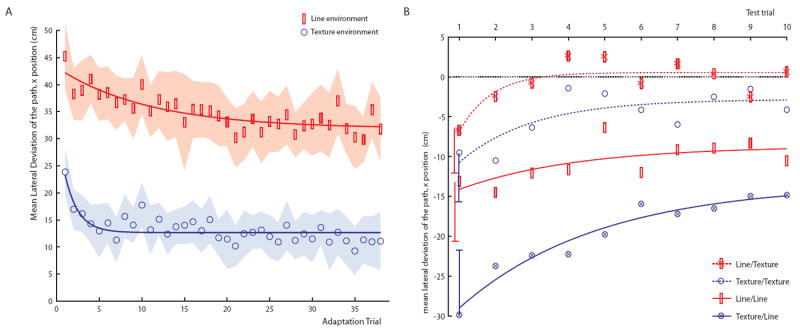
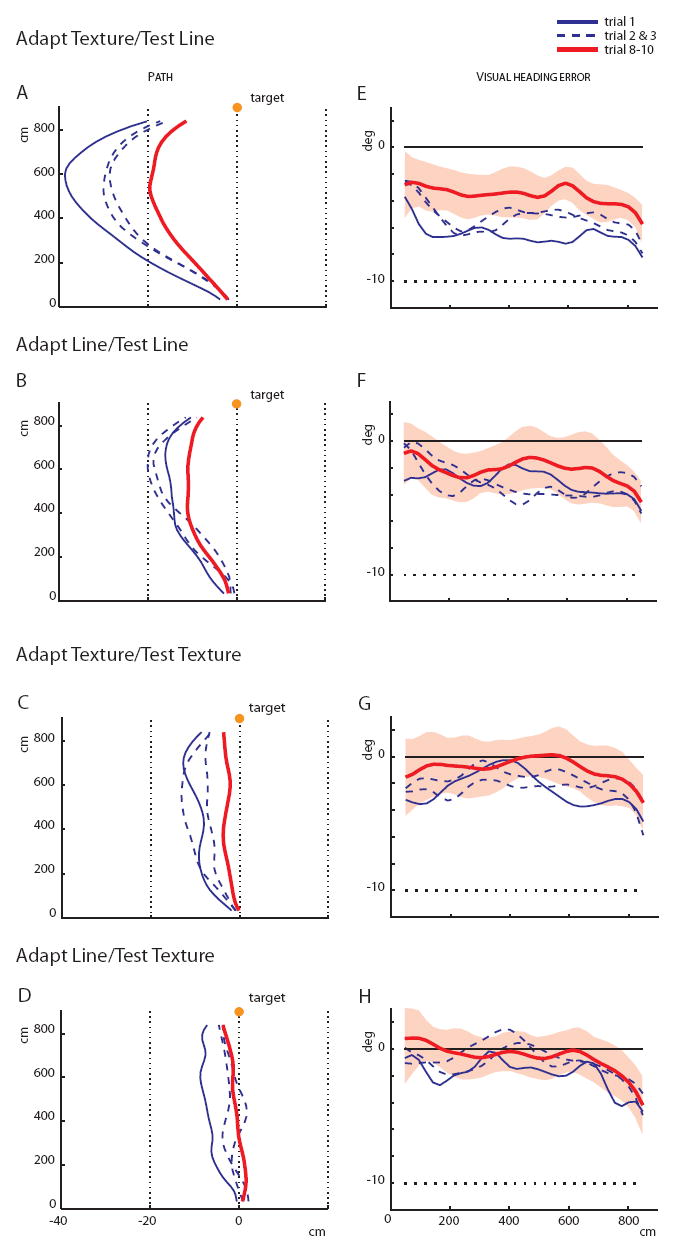
Two strategies can guide walking to a stationary goal: (1) the optic-flow strategy, in which one aligns the direction of locomotion or "heading" specified by optic flow with the visual goal; and (2) the egocentric-direction strategy, in which one aligns the locomotor axis with the perceived egocentric direction of the goal and in which error results in optical target drift. Optic flow appears to dominate steering control in richly structured visual environments, whereas the egocentric- direction strategy prevails in visually sparse environments. Here we determine whether optic flow also drives visuo-locomotor adaptation in visually structured environments. Participants adapted to walking with the virtual-heading direction displaced 10 degrees to the right of the actual walking direction and were then tested with a normally aligned heading. Two environments, one visually structured and one visually sparse, were crossed in adaptation and test phases. Adaptation of the walking path was more rapid and complete in the structured environment; the negative aftereffect on path deviation was twice that in the sparse environment, indicating that optic flow contributes over and above target drift alone. Optic flow thus plays a central role in both online control of walking and adaptation of the visuo-locomotor mapping.


Figures

Figure 1
Figure 1. Experimental displays, in which the virtual heading direction is displaced 10° to the right of the actual walking direction
(A) The Texture environment, in which the focus of expansion in the optic flow specifies the virtual heading through the visual scene. (B) The Line environment, in which a virtual heading to the right of the target produces optical drift of the target to the left. (C) Optic flow strategy (plan view): To keep the virtual heading aligned with the target (as in A), the person “crab walks” by stepping forward and slightly left of the target. This produces a straight path in the Texture environment. Time steps are color coded in the diagram. (D) Egocentric direction strategy (plan view): Walking in the egocentric direction of the target causes the target to drift (as in B), yielding a path that curves around to the left as the walker “chases” the target. The inset plots the increasing drift rate as the target is approached at a typical walking speed of 1 m/s. (Dotted line at 4 deg/s is the threshold at which target motion influences locomotion [23].
Figure 2
Figure 2. Adaptation phase results
(A, B) Plan view of walking paths in the Texture and Line environments, showing the mean paths for the first three adaptation trials (blue curves) and the mean of the last three trials (red curve). Dotted curve (black) is the prediction of the egocentric direction strategy, Y-axis corresponds to the prediction of the optic flow strategy. (C, D) Mean virtual heading error as a function of distance in the Texture and Line environments. Dotted line is the egocentric direction prediction, solid line is the optic flow prediction; shading corresponds to the 95% confidence interval for the last three trials based on between-subject variability.
Figure 3
Figure 3. Time course of adaptation and recovery, based on mean lateral deviation as a function of trial number
(A) Adaptation phase: adaptation is more rapid and complete in the Texture environment (blue circles) than in the Line environment (red rectangles). Shading corresponds to the 95% confidence interval for the mean deviation; solid curves represent an exponential fit of the decay in lateral deviation (see Table 1). (B) Test phase: post-adaptation recovery is more rapid and complete in the Texture environment than in the Line environment (crossed symbols indicate groups that switched environments between test and adaptation phases). Error bars indicate the 95% confidence interval for the negative aftereffect in Trial 1, based on between-subject variance. Curves represent an exponential fit of the decay in lateral deviation (see Table 1).
Figure 4
Figure 4. Test phase: Negative aftereffects
(A-D) Plan view of walking paths for each combination of Adaptation and Test conditions, showing the mean paths for the first three adaptation trials (blue curves) and the mean of the last three trials (red curve). (E-H) Mean virtual heading error as a function of distance in the corresponding conditions. Shading corresponds to the 95% confidence interval for the last three trials, based on between-subject variance.

Comment in

References

    1. Gibson JJ. The perception of the visual world. Boston: Houghton Mifflin; 1950.
    1. Warren WH, Kay BA, Zosh WD, Duchon AP, Sahuc S. Optic flow is used to control human walking. Nat Neurosci. 2001;4:213–216. - PubMed
    1. Rushton SK, Harris JM, Lloyd MR, Wann JP. Guidance of locomotion on foot uses perceived target location rather than optic flow. Curr Biol. 1998;8:1191–1194. - PubMed
    1. Rushton SK. Egocentric direction and locomotion. In: Lucia V, Beardsley SA, Rushton SK, editors. Optic flow and beyond. Dordrecht: Kluwer Academic Publishers; 2004. pp. 339–362.
    1. Llewellyn KR. Visual guidance of locomotion. J Exp Psychol. 1971;91:245–261. - PubMed

Publication types

LinkOut - more resources