. 2007 Nov;19(11):3418-36.
doi: 10.1105/tpc.107.055046. Epub 2007 Nov 16.

Genome-wide analysis of mRNA decay rates and their determinants in Arabidopsis thaliana

Affiliations

Genome-wide analysis of mRNA decay rates and their determinants in Arabidopsis thaliana

Reena Narsai et al. Plant Cell. 2007 Nov.

Abstract

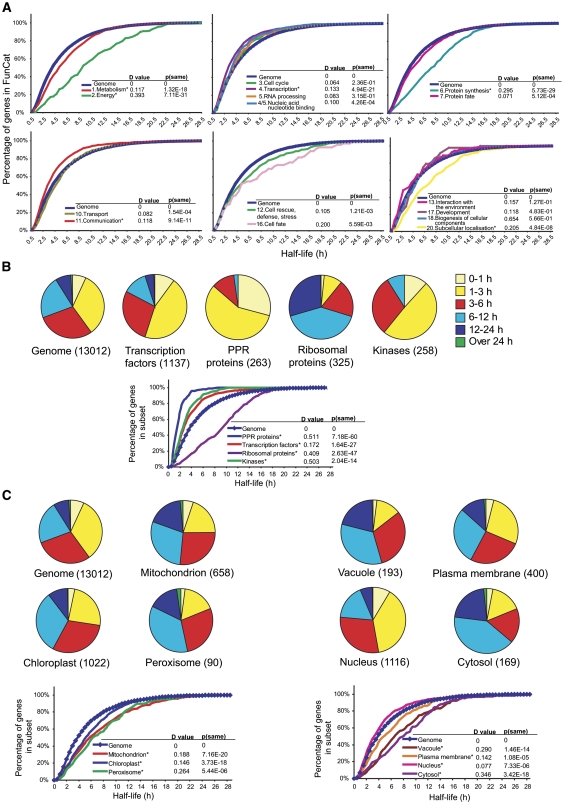
To gain a global view of mRNA decay in Arabidopsis thaliana, suspension cell cultures were treated with a transcriptional inhibitor, and microarrays were used to measure transcript abundance over time. The deduced mRNA half-lives varied widely, from minutes to >24 h. Three features of the transcript displayed a correlation with decay rates: (1) genes possessing at least one intron produce mRNA transcripts significantly more stable than those of intronless genes, and this was not related to overall length, sequence composition, or number of introns; (2) various sequence elements in the 3' untranslated region are enriched among short- and long-lived transcripts, and their multiple occurrence suggests combinatorial control of transcript decay; and (3) transcripts that are microRNA targets generally have short half-lives. The decay rate of transcripts correlated with subcellular localization and function of the encoded proteins. Analysis of transcript decay rates for genes encoding orthologous proteins between Arabidopsis, yeast, and humans indicated that yeast and humans had a higher percentage of transcripts with shorter half-lives and that the relative stability of transcripts from genes encoding proteins involved in cell cycle, transcription, translation, and energy metabolism is conserved. Comparison of decay rates with changes in transcript abundance under a variety of abiotic stresses reveal that a set of transcription factors are downregulated with similar kinetics to decay rates, suggesting that inhibition of their transcription is an important early response to abiotic stress.


Figures

Figure 1.
Figure 1.
Transcriptional Inhibition after Treatment with ActD in Arabidopsis Cell Culture. (A) Transcript abundance of some genes analyzed by both QRT-PCR and microarray analysis with the calculated correlation coefficient given for each transcript. A value of 1.0 was assigned to the level of transcript prior to treatment, and the transcript abundance at all other time points was expressed relative to this value. Each data point represents the mean ± se. The right panel displays transcript abundance of the same genes analyzed by QRT-PCR following mock treatment with ethanol. (B) Examples of mRNA decay profiles (using the microarray data) and the nonlinear least-squares regression curve produced for each gene. Data were regressed using the relative values from all three biological replicates over all the time points using SAS, which allowed the rate of decay for each gene to be determined. The blue line represents the actual data points, and the red line represents the fitted exponential model. WRKY6, WRKY6 transcription factor (At1g62300); OM64, outer mitochondrial membrane protein of 64 kD (At5g09420); MDHAR, monodehydroascorbate reductase (At1g63940); UCP, uncoupling protein (At3g54110); HPR, hydroxypyruvate reductase (At1g68010); TIM14, translocase of the inner membrane protein 14 (At2g35795).
Figure 2.
Figure 2.
Hierarchical Clustering of the Fold Changes in Transcript Abundance for 13,012 Transcripts after Treatment with ActD. For each gene, the transcript abundance at 0 h was set to 1, and the transcript abundance at all other times was expressed in a relative manner. Rapidly decaying transcripts can be seen by a change from red to green at the early time points (indicated in hours at the top of the heat map). An increase in the brightness of green indicates a decrease in transcript abundance. By contrast, slow-decaying transcripts only changed from red to green at later time points.
Figure 3.
Figure 3.
The Distribution of mRNA Half-Lives of the Whole Genome Compared with Subsets of Transcripts with Specific Sequence Features. (A) to (C) The proportion of transcripts in each mRNA half-life category for the whole-genome set and for subsets, including transcripts that are (A) known miRNA targets; (B) contain no introns (light blue), has one or more splice variant/s that does not have an intron (black), or has a one or more splice variants that contain an intron in all the splice variants (i.e., always intron containing [red]) (C); contain a 3′ UTR >300 bp, contain a 3′ UTR intron, has one or more splice variants that contain a retained 3′ UTR, or has one or more slice variants that never contains a 3′ UTR intron in all the splice variants. (D) Transcripts that had 0 h signal intensities of <100, >100 to < 1000, and >1000. The cumulative percentage plots graphically display how the mRNA half-lives are distributed in each category. The D-value represents the distance between the distributions and was used to calculate the Kolmogorov-Smirnov statistic [p(same)] to determine if there was a statistically significant difference (asterisk) between each subset compared with the genome. The number of genes in each data set is indicated in parentheses.
Figure 4.
Figure 4.
The Distribution of mRNA Half-Lives of the Whole Genome Compared with Subsets of Transcripts Encoding Proteins within Specific Functional and Localization Categories. (A) Distribution of the half-lives of transcripts for genes grouped into various functional categories. (B) Distribution of the half-lives of transcripts for genes encoding transcription factors, PPR proteins, kinases, and ribosomal proteins. (C) Distribution of the half-lives of transcripts for genes encoding proteins targeted to various subcellular locations. The number of genes in each data set is indicated in parentheses. Significant differences (asterisks) in distributions when compared with the whole-genome set were determined as outlined in Figure 3.
Figure 5.
Figure 5.
Comparison of the Half-Lives of Transcripts of Orthologous Genes among Arabidopsis, Human, and Yeast. (A) General features of all three mRNA decay studies, including summary statistics for each data set. (B) The distribution of mRNA half-lives across all three species. As there were several transcripts with short mRNA half-lives in all three species, there is a scale break where the scale from 0 to 0.l is smaller (0.02). (C) A comparison of the 627 transcripts classified as “fast”, “moderate 1,” “moderate 2,” or “slow” in yeast and/or humans compared with the respective Arabidopsis orthologous transcripts in the same categories. The number of transcripts in each category is indicated in red, and the number of genes in each category was expressed as a percentage to allow comparison of the proportion of transcripts encoding proteins in different FunCats.
Figure 6.
Figure 6.
Comparison of the Patterns of Transcript Changes Observed upon Treatment with ActD and Several Stresses. (A) SOM analyses of transcript abundance data from microarray analysis following ActD treatment. The transcripts were grouped by a 1 × 5 SOM (labeled C1-C5) using GeneCluster 2.0 software. In each of the graphs, the solid blue line represents the data mean, and the red lines indicate the range of the data fitted to form each cluster. For each of the clusters, n = the number of genes in that cluster, A = the number of decay profiles (following ActD treatment), and SCA = the number of genes whose expression profiles under one or more stress(es) clustered with their respective ActD decay profile. This produced a list of 711 transcripts (total number of SCA) whose expression profile, under at least one stress, clustered with the respective ActD decay profile of that transcript. (B) Heat map of the mRNA decay profiles and stress transcript expression profiles that clustered together. Rapidly decaying transcripts can be seen by a change from red to green at the early time points (indicated in hours at the top of the heat map). An increase in the brightness of green indicates a decrease in transcript abundance. By contrast, slow-decaying transcripts only changed from red to green at later times. For each gene, the transcript abundance at 0 h was set to 1, and the transcript abundance at all other times were expressed in a relative manner. Next to the heat map is a colored distribution representing the six most abundant functional categories in decreasing order from left to right. (C) The 12 transcripts that were found to cluster with three or more stresses. The transcripts that encode transcription factors are indicated in red.

References

    1. Abler, M.L., and Green, P.J. (1996). Control of mRNA stability in higher plants. Plant Mol. Biol. 32 63–78. - PubMed
    1. Adai, A., Johnson, C., Mlotshwa, S., Archer-Evans, S., Manocha, V., Vance, V., and Sundaresan, V. (2005). Computational prediction of miRNAs in Arabidopsis thaliana. Genome Res. 15 78–91. - PMC - PubMed
    1. Bahler, J. (2005). Cell-cycle control of gene expression in budding and fission yeast. Annu. Rev. Genet. 39 69–94. - PubMed
    1. Barreau, C., Paillard, L., and Osborne, H.B. (2006). AU-rich elements and associated factors: Are there unifying principles? Nucleic Acids Res. 33 7138–7150. - PMC - PubMed
    1. Bernstein, J.A., Khodursky, A.B., Lin, P.H., Lin-Chao, S., and Cohen, S.N. (2002). Global analysis of mRNA decay and abundance in Escherichia coli at single-gene resolution using two-color fluorescent DNA microarrays. Proc. Natl. Acad. Sci. USA 99 9697–9702. - PMC - PubMed

Publication types

MeSH terms