Determination of virus burst size in vivo using a single-cycle SIV in rhesus macaques
- PMID: 18025463
- PMCID: PMC2141911
- DOI: 10.1073/pnas.0707449104
Determination of virus burst size in vivo using a single-cycle SIV in rhesus macaques
Abstract
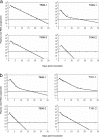
A single-cycle simian immunodeficiency virus (scSIV) that undergoes only one round of infection and replication was constructed to calculate the total number of virons produced by an SIV-infected cell in vivo. Four Mamu-A*01 rhesus macaques were inoculated on two occasions 11 weeks apart with the scSIV by ex vivo infection and i.v. reinfusion of autologous cells. After each inoculation, plasma viral loads peaked between 1 and 2.5 days and then declined exponentially in one or two phases to below detection limits within 2 weeks. Although higher levels of SIV-specific cytotoxic T lymphocytes and modest increases in antibody responses were observed for each animal after the second inoculation, decay rates of the infected cells were only minimally affected. Analyzing the viral load data with a mathematical model, the in vivo viral burst size averaged 4.0 x 10(4) and 5.5 x 10(4) virions per cell for the first and second inoculations, respectively, with no significant difference between the two inoculations. This estimate, in conjunction with our prior understanding of other quantitative viral and cellular parameters during SIV and HIV infection, provides critical insights into the dynamic process of viral production and its interplay with the infected host in vivo.
Conflict of interest statement
The authors declare no conflict of interest.
Figures


References
-
- Eckstein DA, Penn ML, Korin YD, Scripture-Adams DD, Zack JA, Kreisberg JF, Roederer M, Sherman MP, Chin PS, Goldsmith MA. Immunity. 2001;15:671–682. - PubMed
-
- Tsai WP, Conley SR, Kung HF, Garrity RR, Nara PL. Virology. 1996;226:205–216. - PubMed
-
- Chun T-W, Carruth L, Finzi D, Shen X, Digiuseppe JA, Taylor H, Hermankova M, Chadwick K, Margolick J, Quinn TC, et al. Nature. 1997;387:183–188. - PubMed
-
- Haase AT, Henry K, Zupancic M, Sedgewick G, Faust RA, Melroe H, Cavert W, Gebhard K, Staskus K, Zhang Z-Q, et al. Science. 1996;274:985–989. - PubMed
Publication types
MeSH terms
Grants and funding
LinkOut - more resources
Full Text Sources
Other Literature Sources

