. 2007 Nov 27;104(48):18913-8.
doi: 10.1073/pnas.0706114104. Epub 2007 Nov 19.

Kinetics of DNA-mediated docking reactions between vesicles tethered to supported lipid bilayers

Affiliations

Kinetics of DNA-mediated docking reactions between vesicles tethered to supported lipid bilayers

Yee-Hung M Chan et al. Proc Natl Acad Sci U S A. .

Abstract

Membrane-membrane recognition and binding are crucial in many biological processes. We report an approach to studying the dynamics of such reactions by using DNA-tethered vesicles as a general scaffold for displaying membrane components. This system was used to characterize the docking reaction between two populations of tethered vesicles that display complementary DNA. Deposition of vesicles onto a supported lipid bilayer was performed by using a microfluidic device to prevent mixing of the vesicles in bulk during sample preparation. Once tethered onto the surface, vesicles mixed via two-dimensional diffusion. DNA-mediated docking of two reacting vesicles results in their colocalization after collision and their subsequent tandem motion. Individual docking events and population kinetics were observed via epifluorescence microscopy. A lattice-diffusion simulation was implemented to extract from experimental data the probability, P(dock), that a collision leads to docking. For individual vesicles displaying small numbers of docking DNA, P(dock) shows a first-order relationship with copy number as well as a strong dependence on the DNA sequence. Both trends are explained by a model that includes both tethered vesicle diffusion on the supported bilayer and docking DNA diffusion over each vesicle's surface. These results provide the basis for the application of tethered vesicles to study other membrane reactions including protein-mediated docking and fusion.


Conflict of interest statement

The authors declare no conflict of interest.

Figures
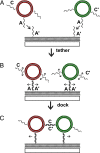
Fig. 1.
Fig. 1.
Graphical illustration of vesicles being tethered to a supported bilayer and subsequent DNA-mediated docking between tethered vesicles. (A) Vesicles with a tethering DNA (sequence A) and docking DNA (sequence C or C′) are incubated with a supported bilayer that displays the complementary tethering DNA (sequence A′). (B) Hybridization of A and A′ tethers the vesicles to the supporting bilayer, and the vesicles are free to diffuse in the plane of the supported bilayer. Tethered vesicle diffusion and diffusion of the docking DNA on the vesicles' surfaces are illustrated with arrows. (C) Collisions between vesicles can lead to docking of tethered vesicles via hybridization of C and C′ DNA.
Fig. 2.
Fig. 2.
Vesicle deposition using a microfluidic device. (A) Schematic of the device. The red and green lines mark the three lanes of flow created by the three inputs. (B) Composite image of the initial locations of OG and TR vesicles on the right and left sides, respectively, of a flow channel. The cross-sectional image was compiled from seven videos taken to span the deposition area.
Fig. 3.
Fig. 3.
Frames taken from SI Movie 1 of a docking event between an OG and a TR vesicle displaying docking oligos. Through frame 61, the vesicles diffuse independently (red and green trajectories). After docking in frame 62, the vesicles diffuse in tandem (yellow trajectory). Frames are taken at 100-ms exposure time.
Fig. 4.
Fig. 4.
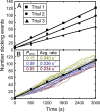
Comparison of experimental and simulation time courses. (A) Plot of the number of docked vesicles versus time for three kinetics trials performed with vesicles labeled with an average of 10 copies of D/D′ DNA. The slope of the best linear fit for the trial 1 time course (squares) gives an effective rate of 0.036 docked vesicles per second. (B) Plot of simulated time courses using the initial conditions from the trial described in Fig. 4A. Ten time courses are plotted for Pdock = 0.05 (red), 0.09 (blue), and 0.15 (yellow). The experimental time course and fit from trial 1 (black with squares, offset to give a y intercept of 0) are overlaid on the simulated time courses. (Inset) Table gives average rates from the simulation plots for different values of Pdock. Pdock = 0.09 gives an average rate of 0.036 s−1, which is the closest match to the experimental rate.

References

    1. Gumbiner BM. Cell. 1996;84:345–357. - PubMed
    1. Dustin ML, Bivona TG, Philips MR. Nat Immun. 2004;5:363–372. - PubMed
    1. Weber T, Zemelman BV, McNew JA, Westermann B, Gmachl M, Palati F, Söllner T, Rothman JE. Cell. 1998;92:759–772. - PubMed
    1. Schuette CG, Hatsuzawa K, Margittai M, Stein A, Riedel D, Küster P, König M, Seidel C, Jahn R. Proc Natl Acad Sci USA. 2004;101:2858–2863. - PMC - PubMed
    1. Dennison SM, Bowen ME, Brunger AT, Lentz BR. Biophys J. 2006;90:1661–1675. - PMC - PubMed

Publication types

LinkOut - more resources