. 2007 Nov-Dec;5(6):492-502.
doi: 10.1370/afm.746.

Pursuing equity: contact with primary care and specialist clinicians by demographics, insurance, and health status

Affiliations

Pursuing equity: contact with primary care and specialist clinicians by demographics, insurance, and health status

Robert L Ferrer. Ann Fam Med. 2007 Nov-Dec.

Abstract

Purpose: Long-term shifts in specialty choice and health workforce policy have raised concern about the future of primary care in the United States. The objective of this study was to examine current use of primary and specialty care across the US population for policy-relevant subgroups, such as disadvantaged populations and persons with chronic illness.

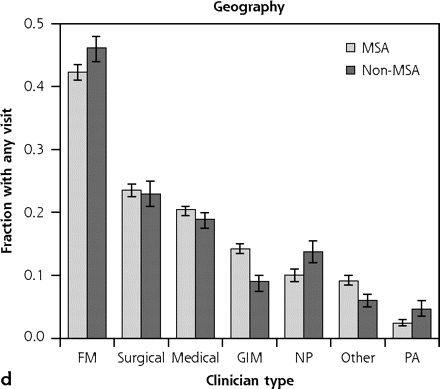
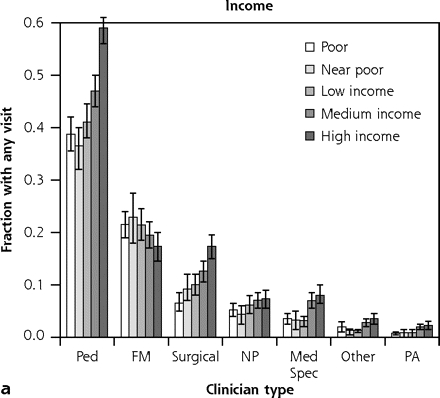
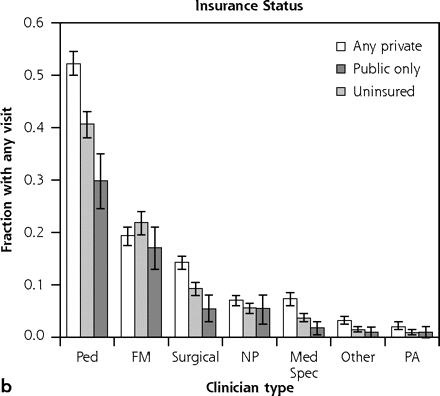
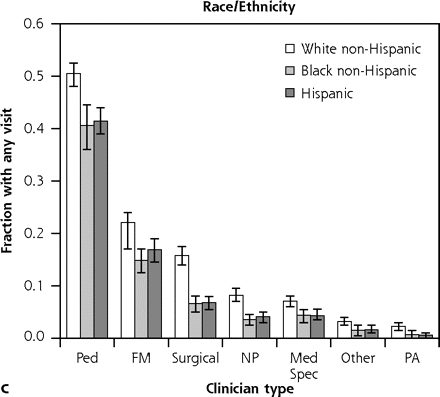
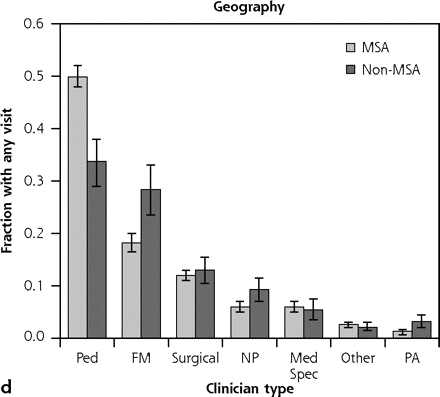
Methods: Data from the Medical Expenditure Panel Survey from 2004 were analyzed using a probability sample patients or other participants from the noninstitutionalized US population in 2004 (N = 34,403). The main and secondary outcome measures were the estimates of the proportion of Americans who accessed different types of primary care and specialty physicians and midlevel practitioners, as well as the fraction of ambulatory visits accounted for by the different clinician types. Data were disaggregated by income, health insurance status, race/ethnicity, rural or urban residence, and presence of 5 common chronic diseases.

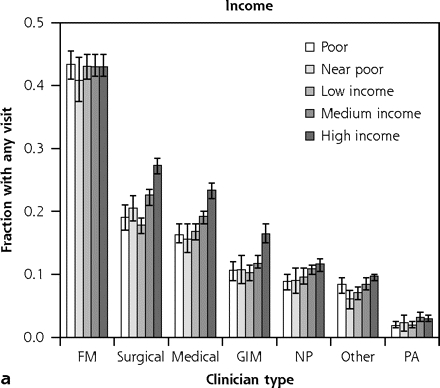
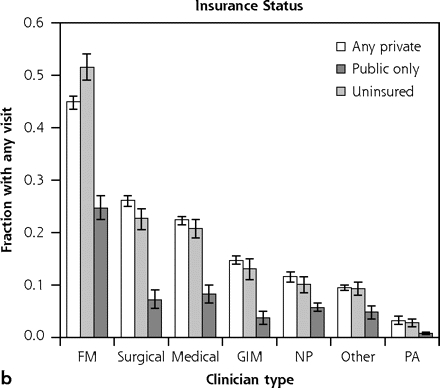
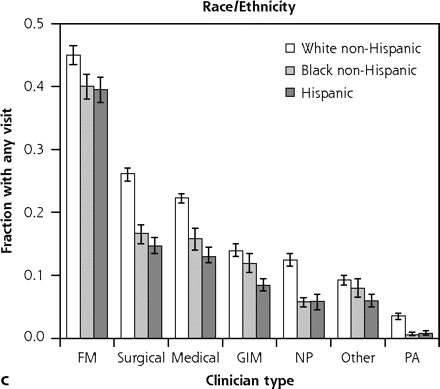
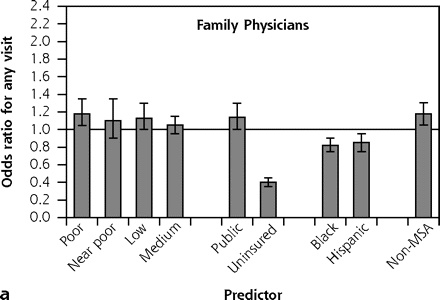
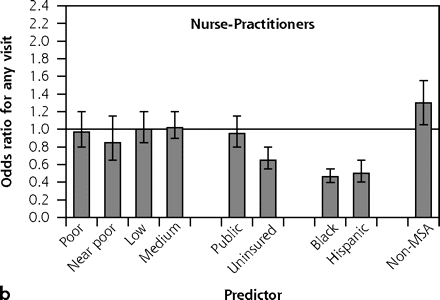
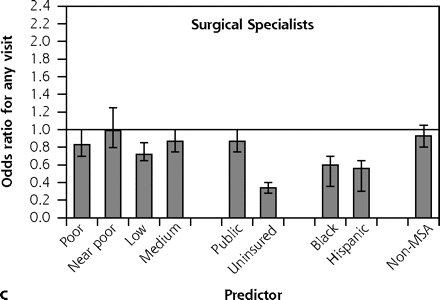
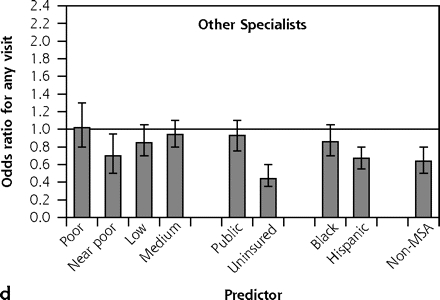
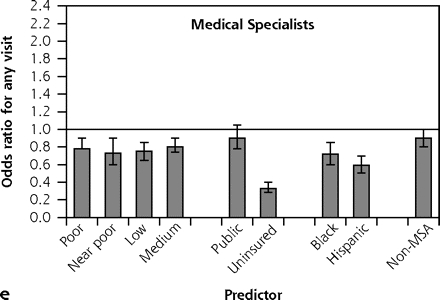
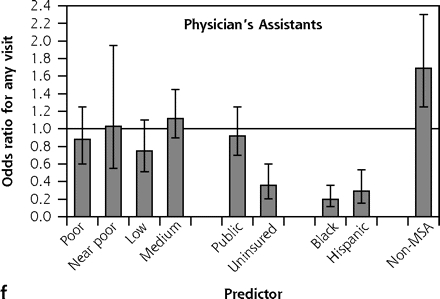
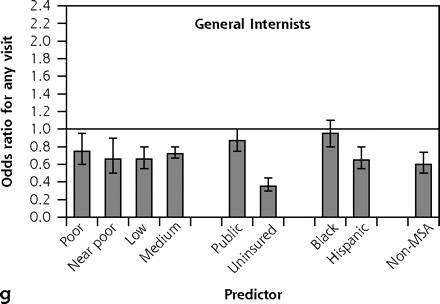
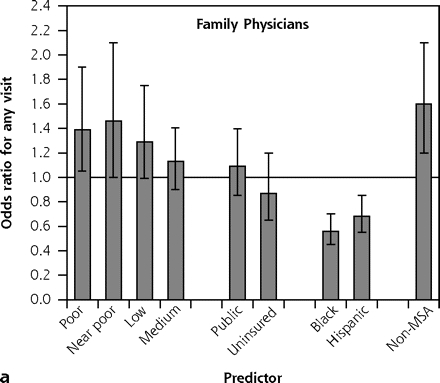
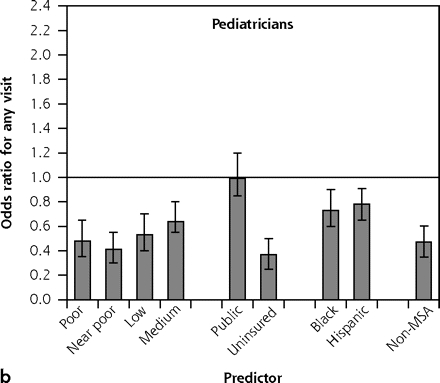
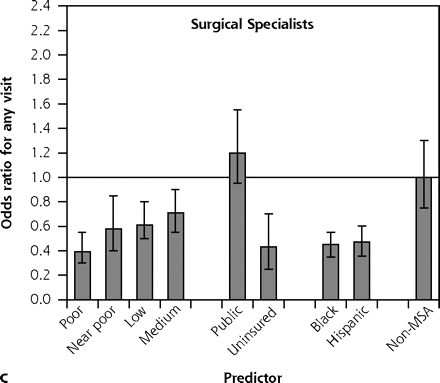
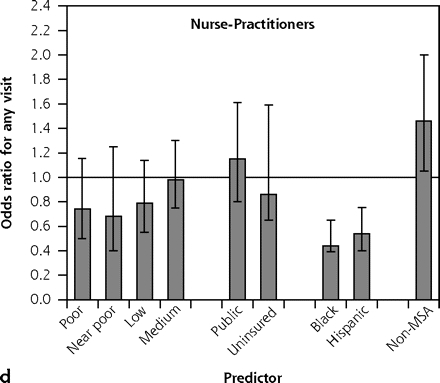
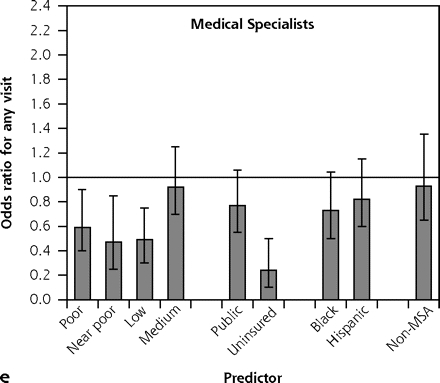
Results: Family physicians were the most common clinician type accessed by adults, seniors, and reproductive-age women, and they were second to pediatricians for children. Disadvantaged adults with 3 markers of disadvantage (poverty, disadvantaged minority, uninsured) received 45.6% (95% CI, 40.4%-50.7%) of their ambulatory visits from family physicians vs 30.5% (95% CI, 30.0%-32.1%) for adults with no markers. For children with 3 vs 0 markers of disadvantage, the proportion of visits from family physicians roughly doubled from 16.5% (95% CI, 14.4%-18.6%) to 30.1% (95% CI, 18.8%-41.2%). Family physicians constitute the only clinician group that does not show income disparities in access. Multivariate analyses show that patterns of access to family physicians and nurse-practitioners are more equitable than for other clinician types.

Conclusions: Primary care clinicians, especially family physicians, deliver a disproportionate share of ambulatory care to disadvantaged populations. A diminished primary care workforce will leave considerable gaps in US health care equity. Health care workforce policy should reflect this important population-level function of primary care.


Figures

Figure 1.
Figure 1.
Fraction of population with any access of specified clinician type—adults: disaggregated by income, insurance status, race/ethnicity, and rural or urban residence. Note: Age- and sex-adjusted estimates, by population subgroups, of the fraction of adults who made any visit in 2004 to specific clinician types. Error bars display 95% confidence intervals for the point estimates. FM = family medicine; GIM = general internal medicine; MSA = metropolitan statistical area; NP = nurse-practitioner; PA = physician’s assistant.
Figure 1.
Figure 1.
Fraction of population with any access of specified clinician type—adults: disaggregated by income, insurance status, race/ethnicity, and rural or urban residence. Note: Age- and sex-adjusted estimates, by population subgroups, of the fraction of adults who made any visit in 2004 to specific clinician types. Error bars display 95% confidence intervals for the point estimates. FM = family medicine; GIM = general internal medicine; MSA = metropolitan statistical area; NP = nurse-practitioner; PA = physician’s assistant.
Figure 2.
Figure 2.
Fraction of population with any access of specified clinician type—children: disaggregated by income, insurance status, race/ethnicity, and rural or urban residence. Note: Age- and sex-adjusted estimates, by population subgroup, of the fraction of children who made any visit in 2004 to specific clinician types. Error bars display 95% confidence intervals for the point estimates. FM = family medicine; MSA = metropolitan statistical area; NP = nurse practitioner; PA = physician‘s assistant; Ped = pediatrics;
Figure 2.
Figure 2.
Fraction of population with any access of specified clinician type—children: disaggregated by income, insurance status, race/ethnicity, and rural or urban residence. Note: Age- and sex-adjusted estimates, by population subgroup, of the fraction of children who made any visit in 2004 to specific clinician types. Error bars display 95% confidence intervals for the point estimates. FM = family medicine; MSA = metropolitan statistical area; NP = nurse practitioner; PA = physician‘s assistant; Ped = pediatrics;
Figure 3.
Figure 3.
Odds ratios of any access by clinician type—adults. Note: Each panel displays results from a separate multivariate logistic regression equation; the dependent variable was any visit to the specified clinician type in 2004. Adjusted odds ratios appear on the y-axis, simultaneously adjusting for age, sex, income, health insurance status, race/ethnicity, and rural/urban residence. Reference groups were, respectively, high income, private insurance, white non-Hispanic, and MSA resident. Error bars display 95% confidence intervals for the odds ratios. Horizontal line is drawn at odds ratio = 1. MSA=metropolitan statistical area.
Figure 3.
Figure 3.
Odds ratios of any access by clinician type—adults. Note: Each panel displays results from a separate multivariate logistic regression equation; the dependent variable was any visit to the specified clinician type in 2004. Adjusted odds ratios appear on the y-axis, simultaneously adjusting for age, sex, income, health insurance status, race/ethnicity, and rural/urban residence. Reference groups were, respectively, high income, private insurance, white non-Hispanic, and MSA resident. Error bars display 95% confidence intervals for the odds ratios. Horizontal line is drawn at odds ratio = 1. MSA=metropolitan statistical area.
Figure 4.
Figure 4.
Odds ratios of any access by clinician type—children. Note: Each panel displays results from a separate multivariate logistic regression equation; the dependent variable was any visit to the specified clinician type in 2004. Adjusted odds ratios appear on the y-axis, simultaneously adjusting for age, sex, income, health insurance status, race/ethnicity, and rural/urban residence. Reference groups were, respectively, high income, private insurance, white non-Hispanic, and MSA resident. Error bars display 95% confidence intervals for the odds ratios. Horizontal line is drawn at odds ratio = 1. MSA = metropolitan statistical area.
Figure 4.
Figure 4.
Odds ratios of any access by clinician type—children. Note: Each panel displays results from a separate multivariate logistic regression equation; the dependent variable was any visit to the specified clinician type in 2004. Adjusted odds ratios appear on the y-axis, simultaneously adjusting for age, sex, income, health insurance status, race/ethnicity, and rural/urban residence. Reference groups were, respectively, high income, private insurance, white non-Hispanic, and MSA resident. Error bars display 95% confidence intervals for the odds ratios. Horizontal line is drawn at odds ratio = 1. MSA = metropolitan statistical area.

References

    1. American College of Physicians. The impending collapse of primary care medicine and its implications for the state of the nation’s health care: a report from the American College of Physicians. January 30, 2006. http://www.acponline.org/hpp/statehc06_1.pdf. Accessed March 30, 2006.
    1. Robinson JC. The end of managed care. JAMA. 2001;285(20): 2622–2628. - PubMed
    1. Philibert I. An interview with Carl Getto, MD. ACGME Bulletin. Spring 2004:10–11.
    1. Council on Graduate Medical Education. Third Report: Improving Access to Health Care Through Physician Workforce Reform: Directions for the 21st Century. Rockville, MD: US Department of Health and Human Services; 1992. - PubMed
    1. Salsberg E. Physician Workforce Policy Guidelines for the U.S. for 2000–2020. Presented to the Council on Graduate Medical Education. Bethesda, MD. September 17–18, 2003.

MeSH terms