. 2008 Jan;4(1):33-41.
doi: 10.1038/nchembio.2007.54. Epub 2007 Nov 18.

Dorsomorphin inhibits BMP signals required for embryogenesis and iron metabolism

Affiliations

Dorsomorphin inhibits BMP signals required for embryogenesis and iron metabolism

Paul B Yu et al. Nat Chem Biol. 2008 Jan.

Abstract

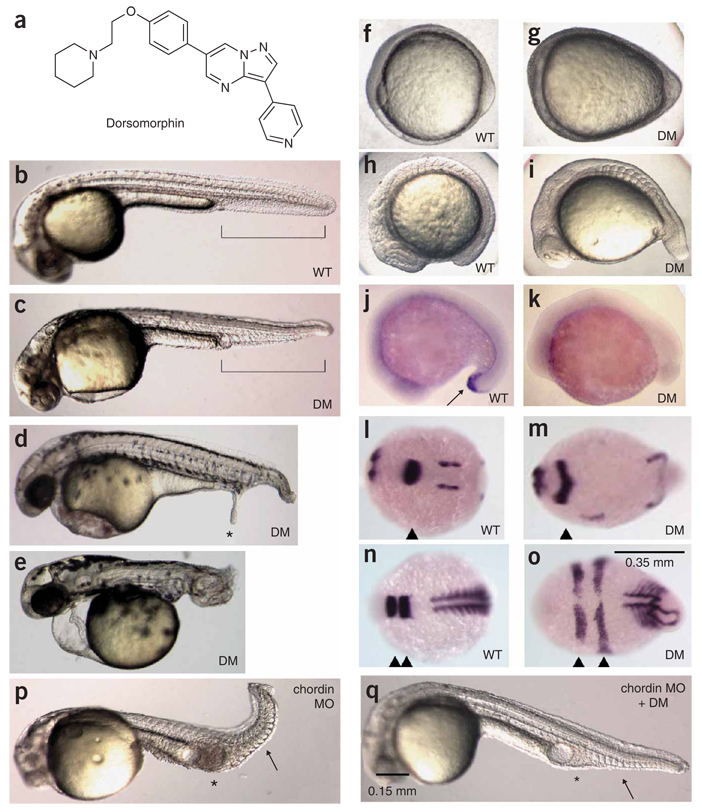
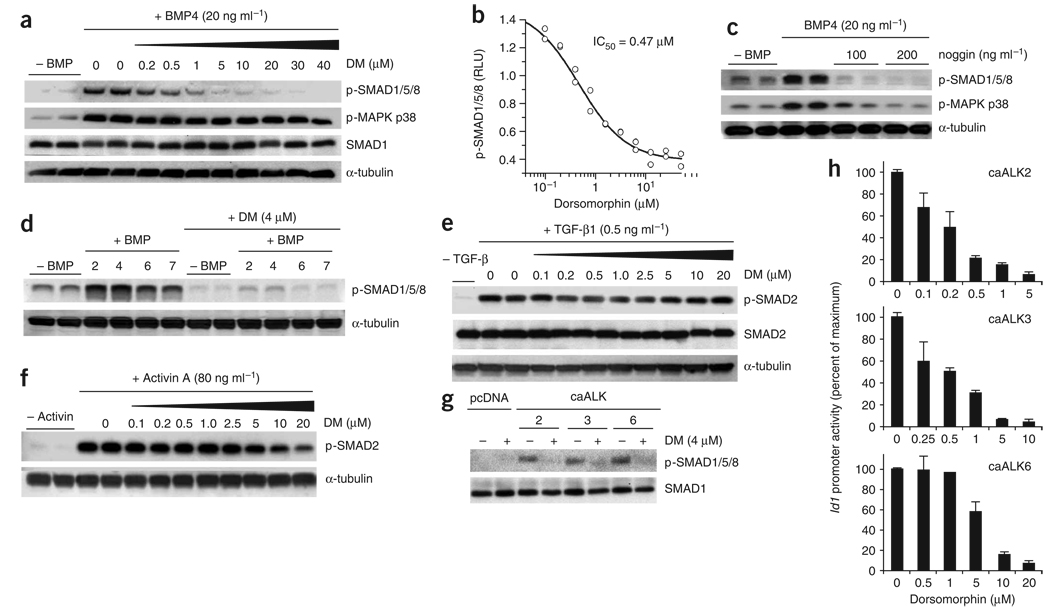
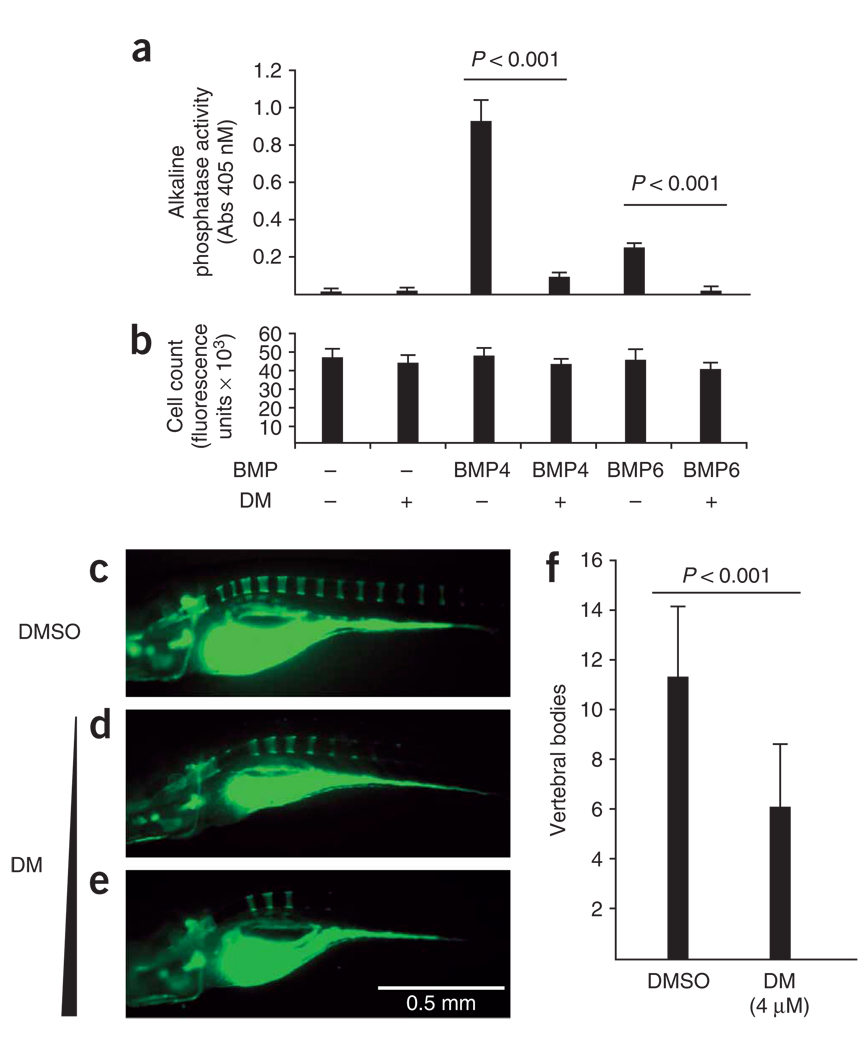
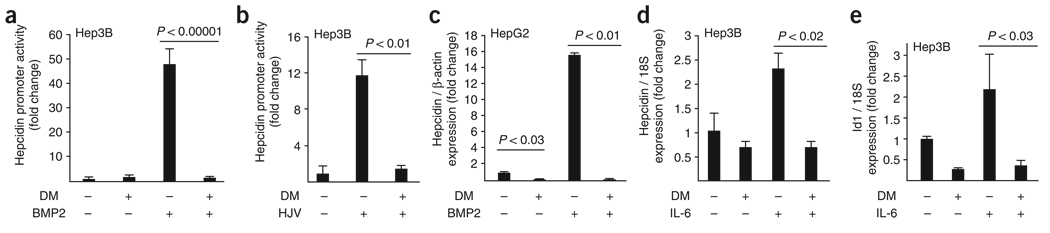
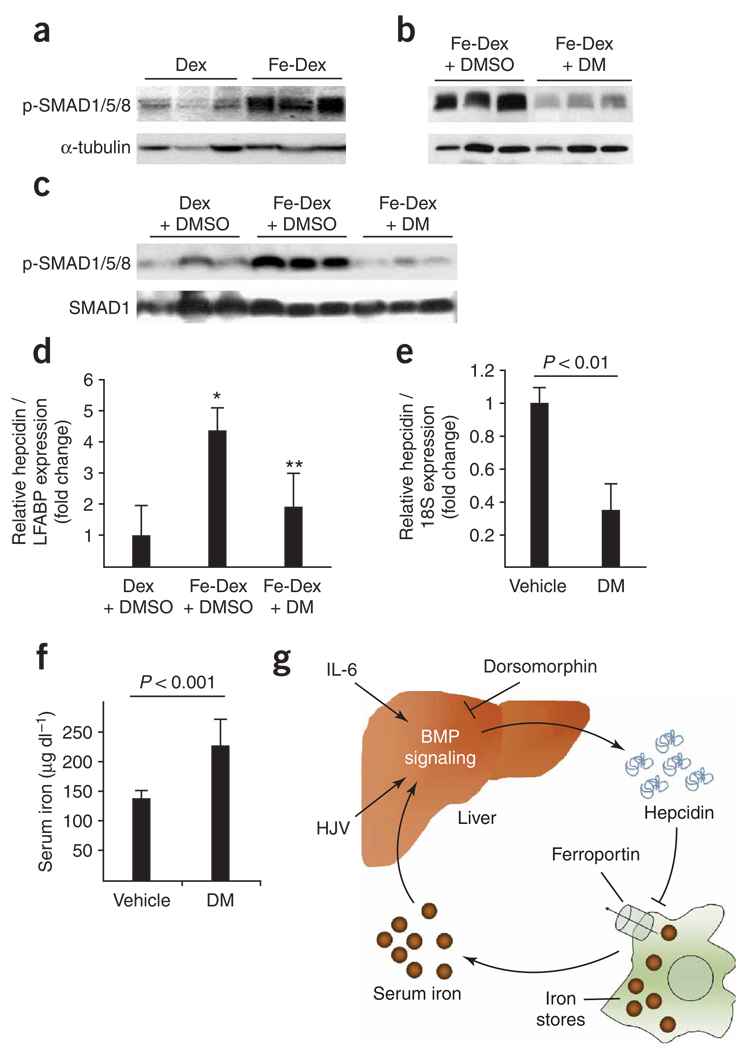
Bone morphogenetic protein (BMP) signals coordinate developmental patterning and have essential physiological roles in mature organisms. Here we describe the first known small-molecule inhibitor of BMP signaling-dorsomorphin, which we identified in a screen for compounds that perturb dorsoventral axis formation in zebrafish. We found that dorsomorphin selectively inhibits the BMP type I receptors ALK2, ALK3 and ALK6 and thus blocks BMP-mediated SMAD1/5/8 phosphorylation, target gene transcription and osteogenic differentiation. Using dorsomorphin, we examined the role of BMP signaling in iron homeostasis. In vitro, dorsomorphin inhibited BMP-, hemojuvelin- and interleukin 6-stimulated expression of the systemic iron regulator hepcidin, which suggests that BMP receptors regulate hepcidin induction by all of these stimuli. In vivo, systemic challenge with iron rapidly induced SMAD1/5/8 phosphorylation and hepcidin expression in the liver, whereas treatment with dorsomorphin blocked SMAD1/5/8 phosphorylation, normalized hepcidin expression and increased serum iron levels. These findings suggest an essential physiological role for hepatic BMP signaling in iron-hepcidin homeostasis.


Figures

Figure 1
Figure 1
Dorsomorphin induces dorsalization in zebrafish embryos. (a) Structure of dorsomorphin. (b) Vehicle-treated WT zebrafish embryo 36 h.p.f. Ventral tail fin is highlighted in brackets. (c) Zebrafish embryo treated with 10 µM dorsomorphin (DM) at 6–8 h.p.f. and photographed at 36 h.p.f. (d) Zebrafish embryos treated with 10 µM dorsomorphin at 6 h.p.f. occasionally develop ectopic tails (*) at 48 h.p.f. (e) Embryos treated with 10 µM dorsomorphin at 1–2 h.p.f. show severe dorsalization at 48 h.p.f. Embryos b–e are shown on lateral view. (f,g) Bud stage embryos left untreated (f) or treated at 2 h.p.f. with dorsomorphin (g) are shown on ventral view. (h,i) 10-somite-stage embryos left untreated (h) or treated at 2 h.p.f. with dorsomorphin (i) are shown on lateral view. (j,k) In situ hybridization of 18-somite stage WT embryos (lateral view) reveals typical expression of the ventral marker eve1 (arrow) in the distal tail (j), whereas embryos treated with dorsomorphin (10 µM) at 1 h.p.f. do not (k). (l–o) In situ hybridization of 6-somite-stage (12 h.p.f.) embryos (dorsal view, anterior left). The mid-hindbrain boundary is marked by pax2a (l and m, arrowheads). Rhombomeres 3 and 5 are marked by egr2b (krox20) (n and o, arrowheads), and somitic mesoderm is marked by myod (n and o). (p,q) Embryos injected with 1 ng chordin morpholino were treated with vehicle (p) or 20 µM dorsomorphin at 2 h.p.f. (q) and photographed 36 h.p.f. Dorsomorphin treatment normalizes expanded intermediate cell mass (*) and ventral tail fin structures (arrow).
Figure 2
Figure 2
Dorsomorphin inhibits BMP-mediated activation of SMAD by inhibiting BMP type I receptor function. (a) Phosphorylation of SMAD1/5/8 and MAPK p38 in PASMCs detected by immunoblot after pretreatment with dorsomorphin for 30 min followed by treatment with BMP4 for 30 min. Equivalent protein loading was confirmed by detection of total SMAD1 and α-tubulin. (b) Hill plot of the inhibition of BMP4-stimulated SMAD1/5/8 phosphorylation by incubating PASMCs with dorsomorphin. RLU, relative light units. (c) Phosphorylation of SMAD1/5/8 and MAPK p38 in PASMCs after pretreatment with noggin for 30 min followed by treatment with BMP4 for 30 min. (d) Phosphorylation of SMAD1/5/8 in PASMCs after stimulation by BMP2, BMP4, BMP6 and BMP7 (10 ng ml−1) detected by immunoblot with and without pretreatment with dorsomorphin (4 µM) for 30 min. (e) SMAD2 phosphorylation in PASMCs treated with TGF-β1. Pretreatment with dorsomorphin (0.1–20 µM) did not inhibit TGF-β1–mediated activation of SMAD2 at 30 min. (f) SMAD2 phosphorylation in PASMCs treated with activin A. Dorsomorphin inhibited activin A–mediated activation of SMAD2 only modestly at concentrations ≥10 µM. (g) Levels of phosphorylated SMAD1/5/8 in cell extracts from BMPR-II–deficient PASMCs transiently transfected with constitutively active type I receptor cDNA (caALK2, caALK3 or caALK6), with or without coincubation with dorsomorphin (10 µM), as detected by immunoblot. pcDNA indicates plasmid-only control. (h) Transient transfection of BMPR-II–deficient PASMCs with caALK2, caALK3 or caALK6 resulted in 5- to 12-fold increases in Id1 promoter activity (BRE-Luc). Id1 promoter activity mediated by each of the constitutively active type I receptors was decreased by cotreatment with dorsomorphin in a dose-dependent manner (n = 3, results expressed as mean ± s.d.).
Figure 3
Figure 3
Dorsomorphin inhibits osteogenic differentiation in vitro and bone mineralization in vivo. (a) Alkaline phosphatase activity as a marker of osteoblastic differentiation in C2C12 cells after treatment with BMP4 or BMP6 during 5 d of culture. Pretreatment with dorsomorphin (4 µM) inhibited BMP-mediated induction of alkaline phosphatase activity (n = 6 for each condition, results expressed as mean ± s.d.). (b) Treatment of C2C12 cells with dorsomorphin did not affect cell count as assayed using DNA-binding dye (CyQuant). (c–e) Visualization of calcified skeletal structures in zebrafish by calcein fluorescence staining at 10 d.p.f., left lateral view. DMSO-treated fish showed normal vertebral staining of 11–14 segments (c). Treatment of zebrafish at 24 h.p.f. with dorsomorphin (1–4 µM) resulted in viable fish at 10 d.p.f. without evidence of dorsalization. However, a decrease in vertebral segment and craniofacial bone calcification was observed with dorsomorphin-treated fish relative to vehicle-treated fish (d and e). (f) With dorsomorphin treatment at 4 µM, a 45% decrease (P < 0.001) in the number of mineralized vertebrae was observed (n = 19 for DMSO; n = 18 for dorsomorphin treated; results expressed as mean ± s.d.).
Figure 4
Figure 4
Dorsomorphin inhibits BMP- and HJV-induced hepcidin expression in cultured hepatoma-derived cells. (a) Treatment of Hep3B cells with BMP2 (25 ng ml−1) increased hepcidin promoter activity nearly 50-fold compared with untreated cells, as measured by the hepcidin luciferase reporter assay (Hep-Luc). Cotreatment with dorsomorphin (10 µM) abrogated the induction of hepcidin promoter activity by BMP2 (triplicate measurements, results expressed as mean ± s.d.). (b) Transfection of Hep3B cells with HJV increased hepcidin promoter activity 12-fold. Treatment with dorsomorphin blocked the HJV-mediated increase in hepcidin promoter activity (triplicate measurements, results expressed as mean ± s.d.). (c) Levels of hepcidin mRNA were measured in HepG2 cells by qRT-PCR. Treatment with dorsomorphin (10 µM) reduced basal hepcidin expression by 50-fold. Treatment with BMP2 increased hepcidin by 16-fold over the basal level. Treatment with dorsomorphin (10 µM) in combination with BMP2 reduced the levels of hepcidin mRNA to below the basal level (triplicate measurements, results are expressed as mean ± s.d.) (d–e) In Hep3B cells, levels of hepcidin (d) and Id1 (e) mRNA measured by qRT-PCR were increased in response to IL-6 (100 ng ml−1) treatment for 6 h. Treatment with dorsomorphin (4 µM) alone or in combination with IL-6 reduced the levels of hepcidin and Id1 mRNA to below basal levels, with no effect on expression of the control gene (18S rRNA) (triplicate measurements, results are expressed as mean ± s.d.).
Figure 5
Figure 5
Dorsomorphin inhibits iron-mediated BMP-responsive SMAD activation and expression of hepcidin. (a) SMAD1/5/8 phosphorylation (normalized to α-tubulin levels) in adult zebrafish liver extracts 1 h after intraperitoneal injection of dextran (Dex) or iron-dextran (Fe-Dex) (n = 3 for each group, P < 0.001, t-test). (b) SMAD1/5/8 phosphorylation in zebrafish livers injected with iron-dextran and vehicle (Fe-Dex + DMSO) or coinjected with iron-dextran and dorsomorphin at 23 µg g−1 (Fe-Dex + DM) (n = 3 for each group, P < 0.03, t-test). (c) SMAD1/5/8 phosphorylation in liver extracts from mice 1 h after intravenous injection with dextran and vehicle (Dex + DMSO), iron-dextran and vehicle (Fe-Dex + DMSO) or iron-dextran and dorsomorphin (Fe-Dex + DM) (P = 0.01, Fe-Dex versus Dex; P < 0.0003, Fe-Dex + DM versus Fe-Dex; t-test). (d) Hepatic hepcidin mRNA levels (normalized to liver fatty acid binding protein mRNA levels) from zebrafish injected intraperitoneally with dextran and vehicle (Dex + DMSO), iron-dextran and vehicle (Fe-Dex + DMSO), or iron-dextran with 23 µg g−1 dorsomorphin (Fe-Dex + DM, n = 4 for each group, *P < 0.01, **P < 0.02, ANOVA). (e) Hepatic hepcidin mRNA levels in C57BL/6 mice 6 h after a single tail vein injection of vehicle or dorsomorphin (10 mg kg−1) (n = 6 for each group, P < 0.01, t-test). (f) Serum iron levels in mice 24 h after the first of two intraperitoneal injections of dorsomorphin (10 mg kg−1) 12 h apart (n = 8 WT, n = 7 dorsomorphin, P < 0.001, t-test). Results in d–f are expressed as mean ± s.d. Panels are representative of two (c–e) or three (a,b,f) independent experiments each. (g) Proposed model for the role of BMP signaling in iron homeostasis. See discussion for details.

Comment in

References

    1. Nguyen VH, et al. Ventral and lateral regions of the zebrafish gastrula, including the neural crest progenitors, are established by a bmp2b/swirl pathway of genes. Dev. Biol. 1998;199:93–110. - PubMed
    1. Mullins MC, et al. Genes establishing dorsoventral pattern formation in the zebrafish embryo: the ventral specifying genes. Development. 1996;123:81–93. - PubMed
    1. Furthauer M, Thisse B, Thisse C. Three different noggin genes antagonize the activity of bone morphogenetic proteins in the zebrafish embryo. Dev. Biol. 1999;214:181–196. - PubMed
    1. Mintzer KA, et al. Lost-a-fin encodes a type I BMP receptor, Alk8, acting maternally and zygotically in dorsoventral pattern formation. Development. 2001;128:859–869. - PubMed
    1. Zhao GQ. Consequences of knocking out BMP signaling in the mouse. Genesis. 2003;35:43–56. - PubMed

Publication types

MeSH terms

LinkOut - more resources