. 2007 Dec;10(12):1615-24.
doi: 10.1038/nn2013. Epub 2007 Nov 18.

Dopamine neurons encode the better option in rats deciding between differently delayed or sized rewards

Affiliations

Dopamine neurons encode the better option in rats deciding between differently delayed or sized rewards

Matthew R Roesch et al. Nat Neurosci. 2007 Dec.

Abstract

The dopamine system is thought to be involved in making decisions about reward. Here we recorded from the ventral tegmental area in rats learning to choose between differently delayed and sized rewards. As expected, the activity of many putative dopamine neurons reflected reward prediction errors, changing when the value of the reward increased or decreased unexpectedly. During learning, neural responses to reward in these neurons waned and responses to cues that predicted reward emerged. Notably, this cue-evoked activity varied with size and delay. Moreover, when rats were given a choice between two differently valued outcomes, the activity of the neurons initially reflected the more valuable option, even when it was not subsequently selected.


Figures
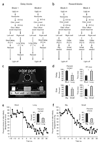
Figure 1
Figure 1
Choice task in which delay and size of reward were manipulated. (a,b) Sequence of events in delay blocks (a) and reward blocks (b). At the start of each recording session one well was randomly designated as short and the other as long (block 1). In the second block of trials these contingencies were switched (block 2). In blocks 3 and 4, we held the delay constant while manipulating the size of the reward. At least 60 trials were collected per block. (c) Picture of apparatus used in task, showing odor port (~ 2.5 cm diameter) and the two fluid wells. (d) The impact of delay length and reward size on behavior on forced-choice trials. Bar graphs show percent correct (left) and reaction time (RT, right) across all recording sessions. (e,f) The impact of delay length and reward size on behavior on free-choice trials that were interleaved within the forced-choice trials. Line graphs show choice behavior before and after the switch from short to long (e) and from big to small (f) reward; inset bar graphs show average percent choice for short versus long (e) or big versus small (f) across all free-choice trials. Asterisks indicate planned comparisons revealing statistically significant differences (t-test, P < 0.05). Error bars, s.e.m.
Figure 2
Figure 2
Locations, representative waveforms and classification of putative dopamine neurons. (a) Location of the electrode track in each rat; boxes indicate approximate extent of lateral (and anteroposterior) spread of the wires (~ 1 mm) centered on the final position (dot). (b) Example waveforms for putative dopamine (DA) and nondopamine (ND) neurons. (c) Results of cluster analysis based on spike duration (d in waveform inset, y-axis, ms) and the amplitude ratio (x-axis) of the initial negative (n in inset) and positive (p in inset) segments. The center and variance of each cluster was computed without data from the neuron of interest, and then that neuron was assigned to a cluster if it was within 3 s.d. of the center. Neurons that met this criterion for more than one cluster were not classified. This process was repeated for each neuron. Putative dopamine neurons are shown in black; neurons that classified with other clusters, no clusters or more than one cluster are shown as open symbols. Neurons recorded before and after intravenous infusion of apomorphine are shown in red. Inset cumulative sum plots show the effects of apomorphine on baseline firing in two DA neurons and one ND neuron.
Figure 3
Figure 3
Activity during reward reflects prediction errors in a subpopulation of cue-responsive dopamine neurons. (a) Left, example of error signaling (negative prediction error) when an expected reward was omitted during the transition from a ‘big’ to a ‘small’ block (gray arrow). Right, example of error signaling (positive prediction error) from the neuron shown in a when reward was instituted during the transition from a ‘small’ to a ‘big’ block (first black arrow). For this neuron, an additional third bolus was delivered several trials later (second black arrow) to further illustrate prediction error encoding. Activity is aligned to the onset of the first unexpected reward. Raster display includes free- and forced-choice trials. Consistent with encoding of errors, activity changes were transient, diminishing as the rats learned to expect (or not expect) reward at that time during each trial block. These effects are quantified during reward omission (left) and reward delivery (right) for dopamine neurons that were cue- and reward-responsive (b; n = 19) and dopamine neurons that were cue-responsive only (c; n = 14) by comparing the average firing rate of each neuron during the 500 ms after an expected reward was omitted (left) or an unexpected reward was instituted (right) in the first five versus the last fifteen trials in the appropriate trial blocks (see text). Black dots represent neurons in which the difference in firing was statistically significant (t-test; P < 0.05). P-values in scatter plots indicate results of chi-square tests comparing the number of neurons above and below the diagonal in each plot. Bar graphs represent average firing rates for each population. Asterisks indicate planned comparisons revealing statistically significant differences (t-test, P < 0.05). Error bars, s.e.m.
Figure 4
Figure 4
Cue-evoked activity in reward-responsive dopamine neurons reflects the value of the predicted rewards. (a) Single-unit example of cue-evoked activity in dopamine neurons on forced-choice trials. Initially the odor predicted that the reward would be delivered immediately (‘short’). Subsequently, the same odor predicted a delayed reward (‘long’), an immediate but large reward (‘big’), and finally an immediate but small reward (‘small’). Note, the ‘short’ and ‘small’ conditions were identical (1 bolus of reward after 500 ms) but differed in their relative value because ‘short’ was paired with ‘long’ in the opposite well whereas ‘small’ was paired with ‘big’. (b) Heat plots showing average activity of all cue/reward-responsive dopamine neurons (n = 19) during the first and last twenty (10 per direction) forced-choice trials in each training block (Fig. 1; blocks 1–4). Activity is shown, aligned on odor onset (‘align odor’) and reward delivery (‘align reward’). Blocks 1–4 are shown in the order performed (top to bottom). During block 1, rats responded after a ‘long’ delay or a ‘short’ delay to receive reward (starting direction (left or right) was counterbalanced in each block and is collapsed here). In block 2, the locations of the ‘short’ delay and ‘long’ delay were reversed. In blocks 3 and 4, delays were held constant but the size of the reward (‘big’ or ‘small’) varied. Line display between heat plots shows the rats’ behavior on free-choice trials that were interleaved within the forced-choice trials from which the neural data were taken. Evidence for encoding of positive and negative prediction errors described in Figure 2 can also be observed here whenever reward is unexpectedly delivered (white arrows) or omitted (gray arrow, analysis epoch). (c,d) Line graphs summarizing the data shown in b. Lines representing average firing rate are broken 1 s after cue onset and 500 ms before reward delivery so that activity can be aligned on both events. Insets: Bar graphs represent average firing rates (gray bar). Blue, short; red, long; green, big; orange, small; dashed, first 10; solid, last 10. Asterisks indicate planned comparisons revealing statistically significant differences (t-test, P < 0.05). Error bars, s.e.m.
Figure 5
Figure 5
Cue-evoked activity in reward-responsive dopamine neurons covaries with the delay and size of the predicted reward and its relative value. (a) Comparison of the difference in firing rate on high- and low- value trials for each cue/reward-responsive neuron (n = 19), calculated separately for ‘delay’ (short-long) and ‘reward’ blocks (big-small). Colored dots represent those neurons that showed a significant difference in firing between ‘high’ and ‘low’ conditions (t-test; P < 0.05; blue: delay; green: reward; black: both reward and delay). Difference scores were significantly higher in the last fifteen trials of each block (right), indicating that cue selectivity developed with learning. Furthermore, the scores calculated from ‘delay’ and ‘reward’ blocks were significantly correlated after learning (right), indicating that encoding of cue value co-varied across the two value manipulations. (b) Average firing rate for the same cue/reward-responsive neurons (n = 19) under ‘short’ versus ‘small’ conditions. Purple dots represent neurons that showed a significant difference in firing between ‘short’ and ‘small’ conditions (t-test, P < 0.05). Neurons were significantly more likely to fire more strongly for a short than for a small reward (chi-square, P < 0.001). (c,d) Same analysis as in a and b for cue-responsive neurons that did not respond to reward (n = 14).
Figure 6
Figure 6
Cue-evoked activity on free-choice trials reflects the more valuable option. (ad) Figures show average activity of all cue/reward-responsive dopamine neurons (n = 19) on forced- and free-choice trials, collapsed across direction, for ‘delay’ (a,b) and ‘reward’ blocks (c,d). To control for learning, we only included trials after behavior reflected the contingencies in the current block (>50% choice of more valuable option). Furthermore, to control for the possibility that low-value choices might be more frequent early during this block of trials, we paired each free-choice trial with the immediately preceding and following forced-choice trial of the same value. The line graphs show average activity from these trials on forced and free-choice trials in each condition, aligned to odor onset. Bar graphs represent the average firing rate (FR) between odor onset to odor offset (top) and the average reaction time (bottom). Blue, short; red, long; green, big; orange, small. Long-forced versus short-free, t-test, P = 0.002; long-forced versus long-free, t-test, P = 0.002; long-forced versus short-forced, t-test, P = 0.001; short-forced versus short-free, t-test, P = 0.641; short-forced versus long-free, t-test, P = 0.431; long-free versus short-free, t-test, P = 0.220; small-forced versus big-free, t-test, P = 0.004; small-forced versus small-free, t-test, P = 0.006; small-forced versus big-forced, t-test, P = 0.002; big-forced versus big-free, t-test, P = 0.244; big-forced versus small-free, t-test, P = 0.104; small-free versus big-free, t-test, P = 0.221.

References

    1. Wise RA. Dopamine, learning and motivation. Nat. Rev. Neurosci. 2004;5:483–494. - PubMed
    1. Schultz W. Getting formal with dopamine and reward. Neuron. 2002;36:241–263. - PubMed
    1. Dayan P, Balleine BW. Reward, motivation and reinforcement learning. Neuron. 2002;36:285–298. - PubMed
    1. Day JJ, Roitman MF, Wightman RM, Carelli RM. Associative learning mediates dynamic shifts in dopamine signaling in the nucleus accumbens. Nat. Neurosci. 2007;10:1020–1028. - PubMed
    1. Mirenowicz J, Schultz W. Importance of unpredictability for reward responses in primate dopamine neurons. J. Neurophysiol. 1994;72:1024–1027. - PubMed

Publication types

MeSH terms