. 2007 Nov-Dec;83(6):1405-14.
doi: 10.1111/j.1751-1097.2007.00180.x.

Characterization of fluorescence of ANS-tear lipocalin complex: evidence for multiple-binding modes

Affiliations

Characterization of fluorescence of ANS-tear lipocalin complex: evidence for multiple-binding modes

Oktay K Gasymov et al. Photochem Photobiol. 2007 Nov-Dec.

Abstract

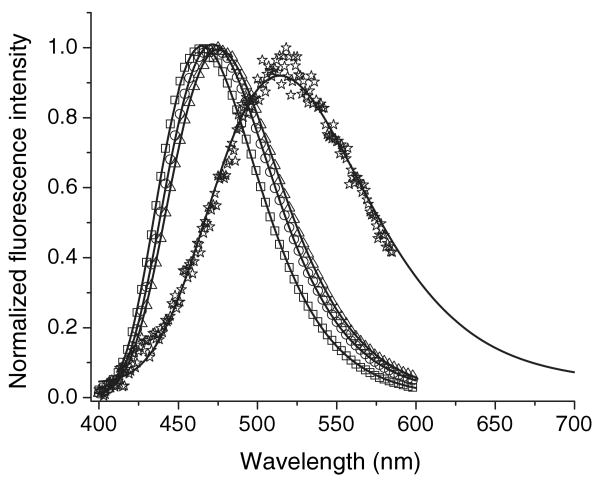
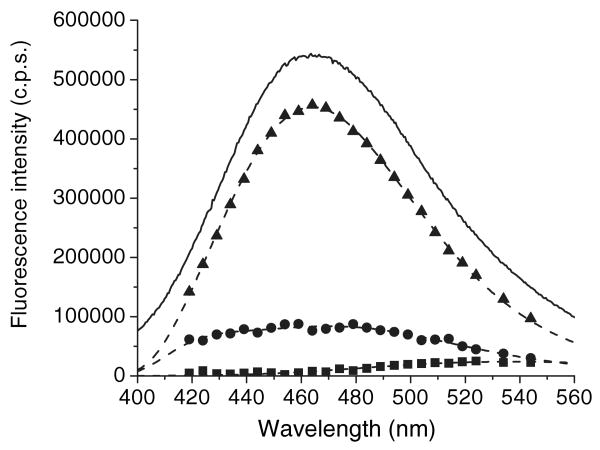
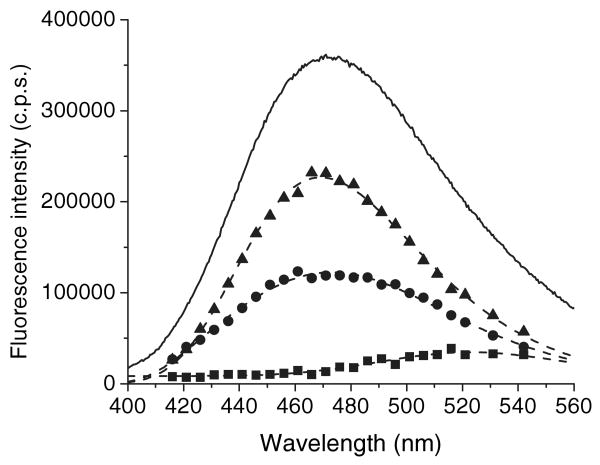
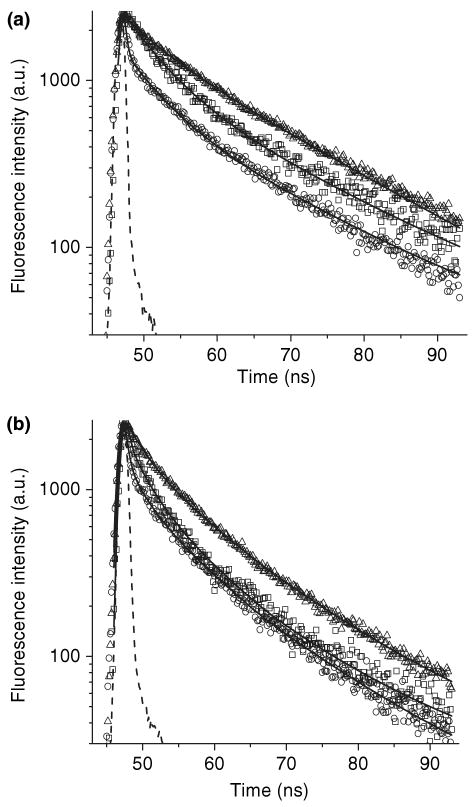
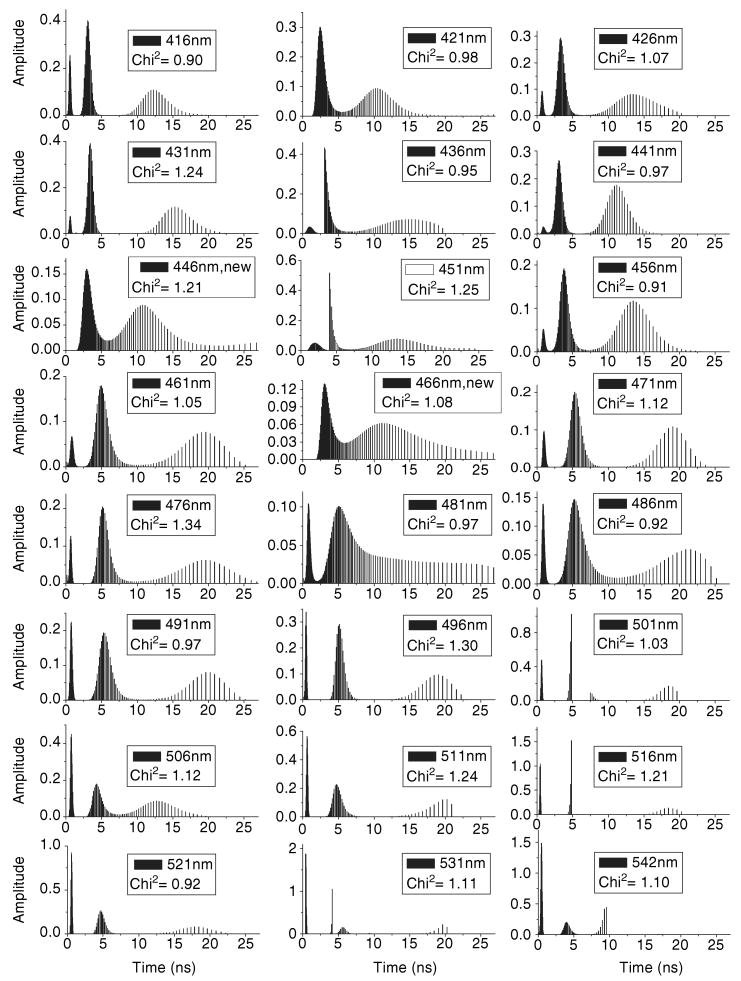
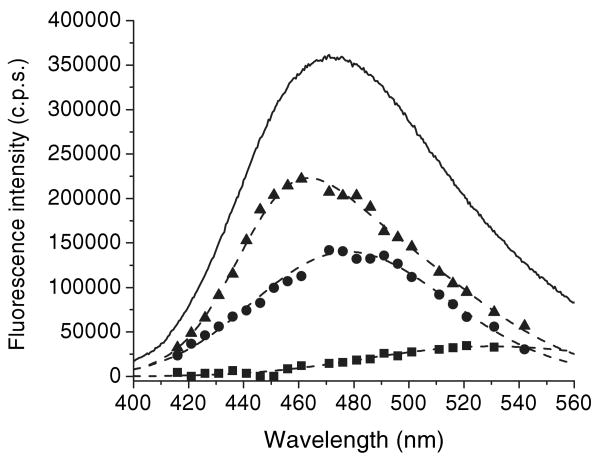
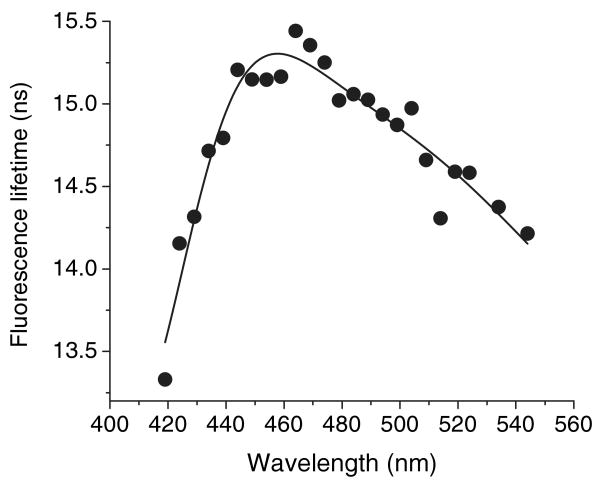
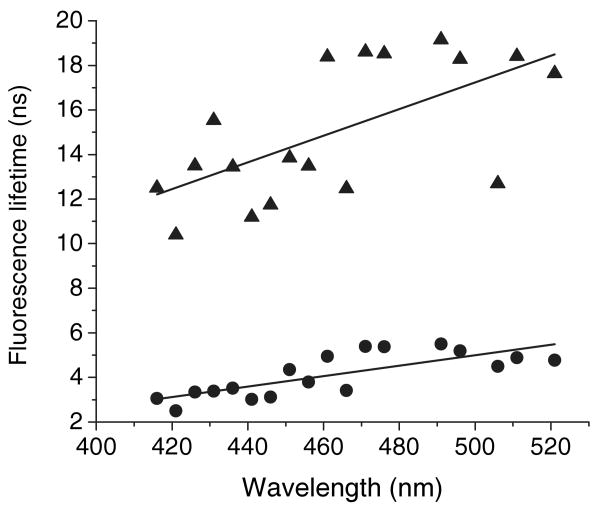
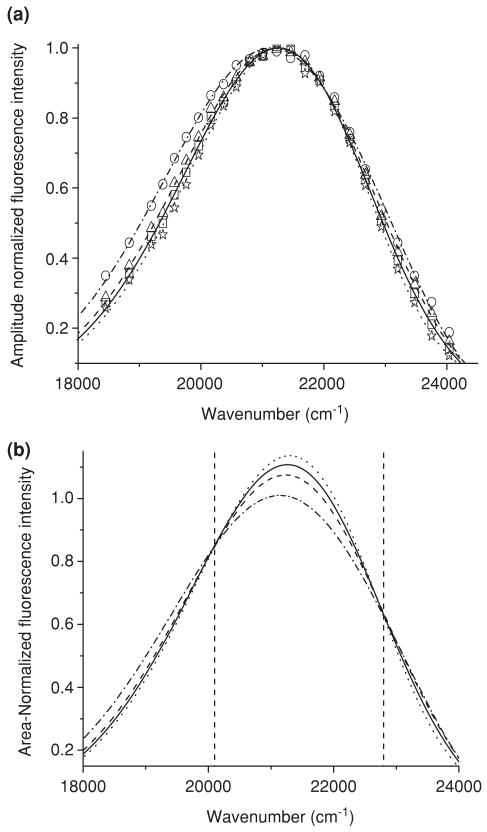
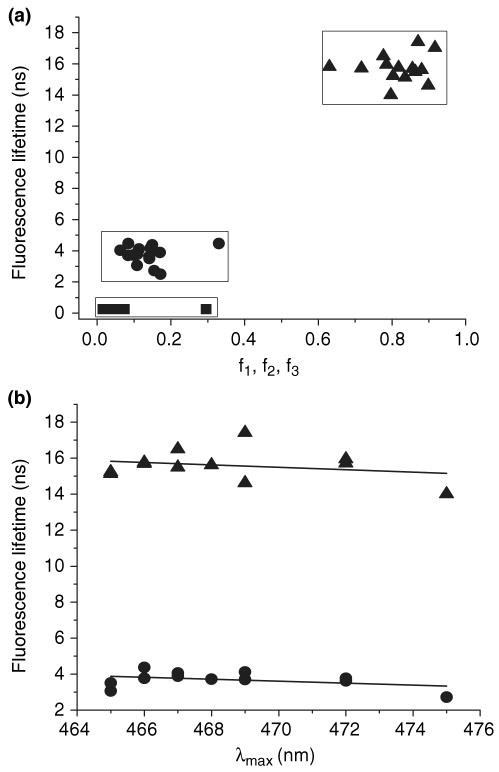
ANS is widely used as a probe for locating binding sites of proteins and studying structural changes under various external conditions. However, the nature of ANS-binding sites in proteins and the accompanying changes in fluorescence properties are controversial. We examined the steady-state and time-resolved fluorescence of the ANS-protein complexes for tear lipocalin (TL) and its mutants in order to discern the origin of lifetime components via analysis that included the multiexponential decay and the model-free maximum entropy methods. Fluorescence lifetimes of ANS-TL complexes can be grouped into two species, 14.01-17.42 ns and 2.72-4.37 ns. The log-normal analyses of fluorescence spectral shapes reveal the heterogeneous nature of both long- and short-lifetime species. The constructed time-resolved emission, amplitude (TRES) and area normalized (TRANES), and decay-associated spectra are consistent with a model that includes heterogeneous modes of ANS binding with two separate lifetime components. The two lifetime components are not derived from solvent relaxation, but rather may represent different binding modes.


Figures

Figure 1
Figure 1
A single log-normal component fitting of the ANS spectra in different solvents. Symbols: square, in dioxane; circle, in ethanol; triangle, in acetonitril; star, in buffer. Solid lines represent log-normal fitting.
Figure 2
Figure 2
The steady state fluorescence spectra and DAS for the mixture of apo-WTL (5 μm) and ANS (15 μm) constructed from global triple-decay time analysis. Symbols: square, 0.25 ns DAS (λmax∼536 nm); circle, 4.09 ns DAS (broad composite spectrum); triangle, 17.33 ns DAS (λmax∼464 nm). Solid line represents the steady-state fluorescence spectrum (λmax∼463 nm). Dashed lines are log-normal fitting of DAS components.
Figure 3
Figure 3
The steady-state fluorescence spectra and DAS for the mixture of apo-G59W (5 μm) and ANS (15 μm) constructed from global triple-decay time analysis. Symbols: square, 0.25 ns DAS (λmax∼523 nm); circle, 4.46 ns DAS (λmax∼472 nm); triangle, 15.82 ns DAS (λmax = 469 ± 0.3 nm). Solid line represents steady-state fluorescence spectrum (λmax∼472 nm). Dashed lines are log-normal fitting of DAS components.
Figure 4
Figure 4
Fluorescence intensity decays of apoWTL (5 μm) ANS (15 μm) (a) and apoG59W (5 μm) ANS (15 μm) (b) complexes at various wavelengths. Symbols: (a) square, 419 nm; triangle, 464 nm; circle, 534 nm and (b) square, 416 nm; triangle, 461 nm; circle, 521 nm. Dashed lines are instrument response function. Solid curves represent the global triple-exponential decay fit.
Figure 5
Figure 5
The lifetime distributions for the mixture of apo-G59W (5 μm) and ANS (15 μm) at different emission wavelengths by MEM decay analysis.
Figure 6
Figure 6
The steady-state fluorescence spectra and DAS for the mixture of apo-G59W (5 μm) and ANS (15 μm) constructed from MEM analysis. Symbols: square, <1 ns DAS (λmax∼535 nm); circle, 2–5 ns DAS (λmax∼478 nm); triangle, >8 ns DAS (λmax∼465 nm). Solid line represents steady-state fluorescence spectrum (λmax∼472 nm). Dashed lines are log-normal fitting of DAS components.
Figure 7
Figure 7
The average lifetimes of the fluorescence for the mixture of apo-G59W (5 μm) and ANS (15 μm) at different wavelengths from triple exponential decay analysis. Free ANS (0.25 ns) is excluded from the calculation of τaver.
Figure 8
Figure 8
The average lifetimes (the long- and short-lifetime components) of fluorescence for the mixture of apo-G59W (5 μm) and ANS (15 μm) at different wavelengths from MEM decay analysis. Symbols: triangle, long-lifetime component; circle, short-lifetime component.
Figure 9
Figure 9
The constructed TRES (a) and TRANES (b) for the mixture of apoG59W (5 μm) and ANS (15 μm) at various time delays. Symbols: dash dot line and circle, 1 ns; dash line and triangle, 5 ns; solid line and square, 10 ns; dot line and star, 20 ns. Symbols are not shown in (b). TRANES show two isoemissive points, 497 nm and 438.6 nm (left and right dashed vertical lines, respectively). The spectra are shown in the wave number scale to be consistent with the literature.
Figure 10
Figure 10
The constructed TRES (a) and TRANES (b) for the mixture of apo-WTL (5 μm) and ANS (15 μm). Symbols: dash dot line and circle, 1 ns; dash line and triangle, 5 ns; solid line and square, 10 ns; dot line and star, 20 ns. Symbols are not shown in (b). TRANES show two isoemissive points, 500.5 and 436.7 nm (left and right dashed vertical lines, respectively). The spectra are shown in wave number scale to be consistent with the literature.
Figure 11
Figure 11
The correlation of fluorescence lifetimes for mutant TL (5 μm) ANS (15 μm) complexes with fractional intensities (a) and λmax (b). Symbols: triangle, circle and square represents long, short and free ANS lifetime components.

References

    1. Son DS, Hariya S, Shimoda M, Kokue E. Contribution of alpha 1-acid glycoprotein to plasma protein binding of some basic antimicrobials in pigs. J Vet Pharmacol Ther. 1996;19:176–183. - PubMed
    1. Uversky VN, Winter S, Lober G. Use of fluorescence decay times of 8-ANS-protein complexes to study the conformational transitions in proteins which unfold through the molten globule state. Biophys Chem. 1996;60:79–88. - PubMed
    1. Semisotnov GV, Rodionova NA, Razgulyaev OI, Uversky VN, Gripas AF, Gilmanshin RI. Study of the “molten globule” intermediate state in protein folding by a hydrophobic fluorescent probe. Biopolymers. 1991;31:119–128. - PubMed
    1. Matulis D, Lovrien R. 1-Anilino-8-naphthalene sulfonate anion-protein binding depends primarily on ion pair formation. Biophys J. 1998;74:422–429. - PMC - PubMed
    1. Ory JJ, Banaszak LJ. Studies of the ligand binding reaction of adipocyte lipid binding protein using the fluorescent probe 1, 8-anilinonaphthalene-8-sulfonate. Biophys J. 1999;77:1107–1116. - PMC - PubMed

Publication types