. 2007 Nov 21;2(11):e1222.
doi: 10.1371/journal.pone.0001222.

A network analysis of the human T-cell activation gene network identifies JAGGED1 as a therapeutic target for autoimmune diseases

Affiliations

A network analysis of the human T-cell activation gene network identifies JAGGED1 as a therapeutic target for autoimmune diseases

Ricardo Palacios et al. PLoS One. .

Abstract

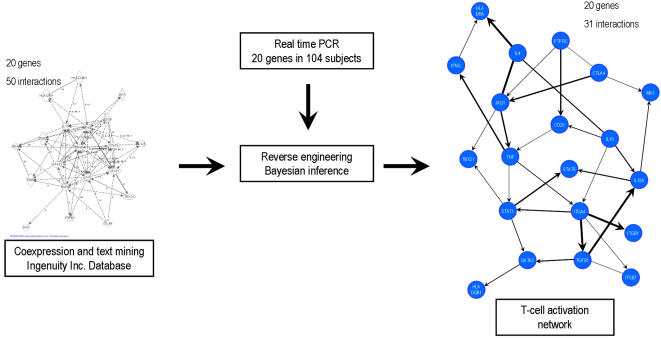
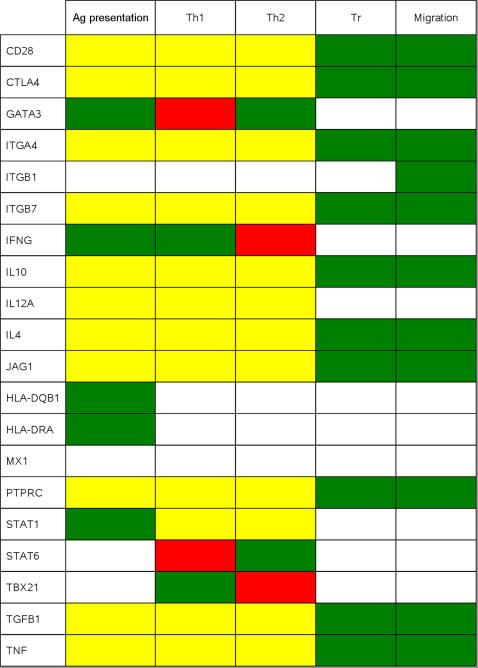
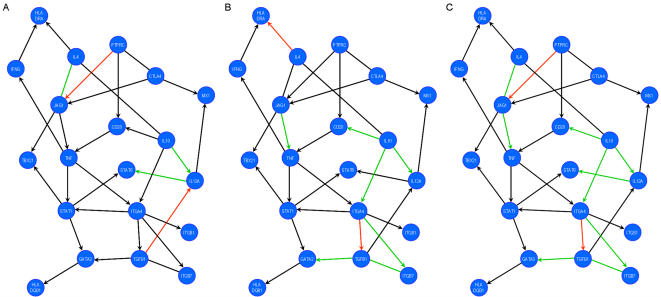
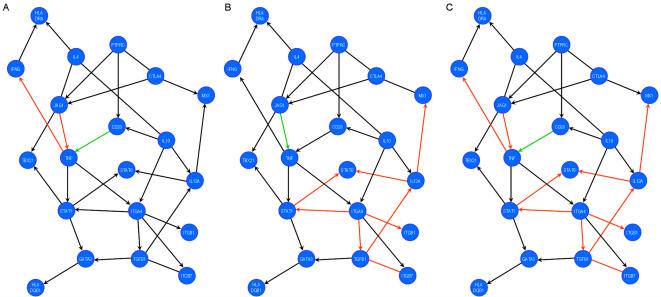
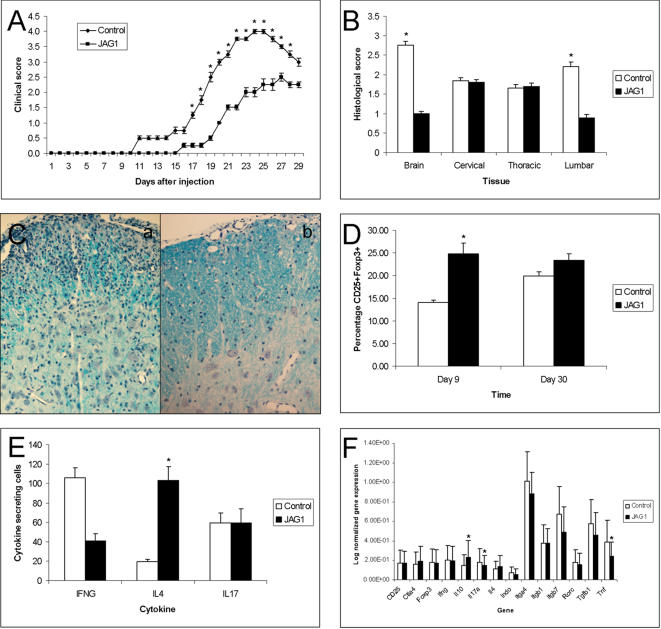
Understanding complex diseases will benefit the recognition of the properties of the gene networks that control biological functions. Here, we set out to model the gene network that controls T-cell activation in humans, which is critical for the development of autoimmune diseases such as Multiple Sclerosis (MS). The network was established on the basis of the quantitative expression from 104 individuals of 20 genes of the immune system, as well as on biological information from the Ingenuity database and Bayesian inference. Of the 31 links (gene interactions) identified in the network, 18 were identified in the Ingenuity database and 13 were new and we validated 7 of 8 interactions experimentally. In the MS patients network, we found an increase in the weight of gene interactions related to Th1 function and a decrease in those related to Treg and Th2 function. Indeed, we found that IFN-ss therapy induces changes in gene interactions related to T cell proliferation and adhesion, although these gene interactions were not restored to levels similar to controls. Finally, we identify JAG1 as a new therapeutic target whose differential behaviour in the MS network was not modified by immunomodulatory therapy. In vitro treatment with a Jagged1 agonist peptide modulated the T-cell activation network in PBMCs from patients with MS. Moreover, treatment of mice with experimental autoimmune encephalomyelitis with the Jagged1 agonist ameliorated the disease course, and modulated Th2, Th1 and Treg function. This study illustrates how network analysis can predict therapeutic targets for immune intervention and identified the immunomodulatory properties of Jagged1 making it a new therapeutic target for MS and other autoimmune diseases.


Conflict of interest statement

Competing Interests: The authors have declared that no competing interests exist.

Figures

Figure 1
Figure 1. Network analysis of the human T-cell activation network:
The structural network was obtained from co-expression analysis using the Ingenuity database. The structural network has 20 genes and we identified 50 links. Using the structural network as a template and the experimental dataset (gene expression levels of the 20 genes from 104 subjects quantified by real time-PCR), we reconstructed the T-cell activation network. The network contains the 20 genes and we identified 31 links (see Table 1 for information about the weight, direction and previous biological knowledge of the links).
Figure 2
Figure 2. Network Analysis: Dependence matrix.
The role of each gene in every T-cell activation function (antigen (Ag) presentation; Th1 differentiation; Th2 differentiation; Treg function; migration) based on the topology of the network is displayed using the following colour code: yellow: dual role (activator or inhibitor); green: full activator; red: full inhibitor; white: no influence.
Figure 3
Figure 3. Comparison of the T-cell activation network between patients and controls.
A) HC versus untreated MS patients; B) untreated MS patients versus MS patients treated with IFN-ß; C) HC versus patients treated with IFN-ß. Comparisons between gene interaction weights are described using the following colour code: black: no change; green: decreased; red: increased. See Table 4 for statistical analysis.
Figure 4
Figure 4. Comparison of the T-cell activation network after in vitro stimulation with jagged1, IFN-ß or Jagged1+IFN-ß:
A) untreated patients versus stimulation with the Jagged1 agonistic peptide for 24 h; B) untreated patients versus stimulation with IFN-B for 24 h; C) untreated patients versus stimulation with JGA1+IFN- ß for 24 h. Comparisons between gene interaction weights are described using the following colour code: black: no change; green: decreased; red: increased. See Table 5 for statistical analysis.
Figure 5
Figure 5. Validation of Jagged1 as a therapeutic target in the animal model of MS:
C57B6 mice (n = 60) were immunized with MOG35–55 and treated with Jagged1 agonist peptide i.p. (n = 30) or placebo (n = 30) from day 0 to day 30 in two different experiments. Twelve animals (6 from each treatment group) were sacrificed by day 9 in order to perform immunological studies. Animals treated with the Jagged1 agonist peptide have a clinical (A) and histological (B) score lower than placebo animals. C) Representative spinal cord sections from placebo (a) and jagged1 (b) treated animals stained with Luxol-fast blue showing a decrease in the presence of inflammatory infiltrates and the extend of demyelination in the Jagged1 treated animals. FACS analysis assessing the percentage of CD25+Foxp3+ Treg cells (D) ELISPOT studies assessing the in vitro secretion of Th1 (INFγ), Th2 (IL-4) and Th17 (IL-17) cytokines (E) and real-time PCR (F) studies in splenocytes from Jagged1 treated and untreated mice. D) Mice treated with Jagged1 peptide have higher percentage of Treg cells than placebo animals by day 9 p.i. (p = 0.032), and such difference disappeared by day 30. E) Splenocytes from Jagged1 treated mice expressed higher levels of IL-4, lower levels of IFNγ and similar levels of Il-17 than placebo animals at day 9 p.i. F) Jagged1 treated animals expressed higher levels of IL-10 and lower levels of TNFα and IL-17 than placebo animals at day 9 p.i. Results are expressed as the mean±SEM

References

    1. Barabasi AL, Oltvai ZN. Network biology: understanding the cell's functional organization. Nat Rev Genet. 2004;5(2):101–113. - PubMed
    1. Lanzavecchia A, Sallusto F. Understanding the generation and function of memory T cell subsets. Curr Opin Immunol. 2005;17(3):326–332. - PubMed
    1. Crabtree GR. Contingent genetic regulatory events in T lymphocyte activation. Science. 1989;243(4889):355–361. - PubMed
    1. Hill N, Sarvetnick N. Cytokines: promoters and dampeners of autoimmunity. Curr Opin Immunol. 2002;14(6):791–797. - PubMed
    1. Steinman L, Zamvil S. Transcriptional analysis of targets in multiple sclerosis. Nat Rev Immunol. 2003;3(6):483–492. - PubMed

Publication types

MeSH terms