. 2007 Nov 21;2(11):e1224.
doi: 10.1371/journal.pone.0001224.

Simple fluorescent sensors engineered with catalytic DNA 'MgZ' based on a non-classic allosteric design

Affiliations

Simple fluorescent sensors engineered with catalytic DNA 'MgZ' based on a non-classic allosteric design

William Chiuman et al. PLoS One. .

Abstract

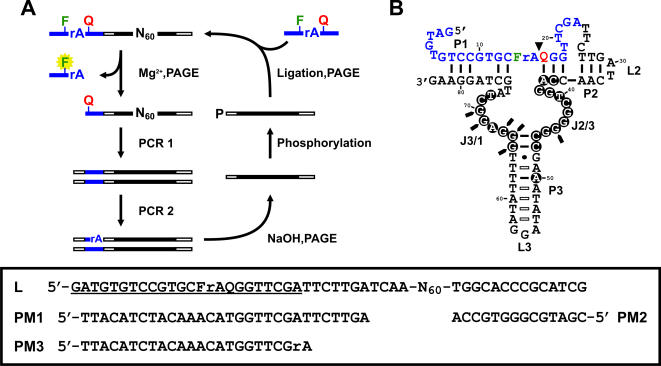
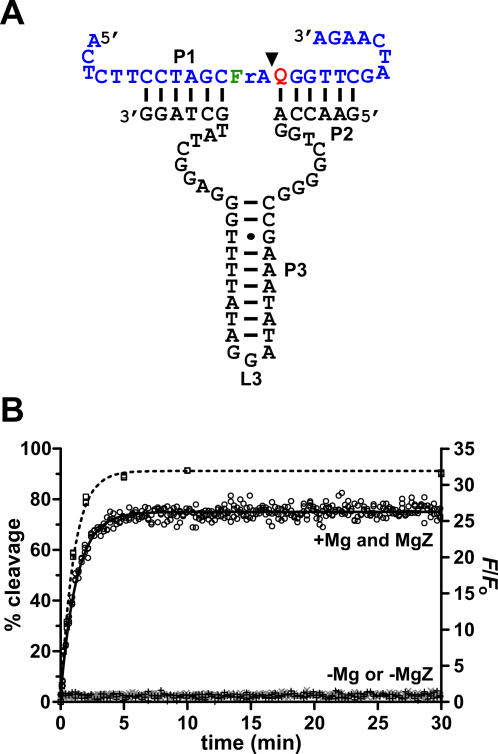
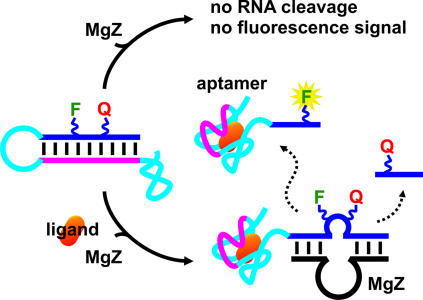
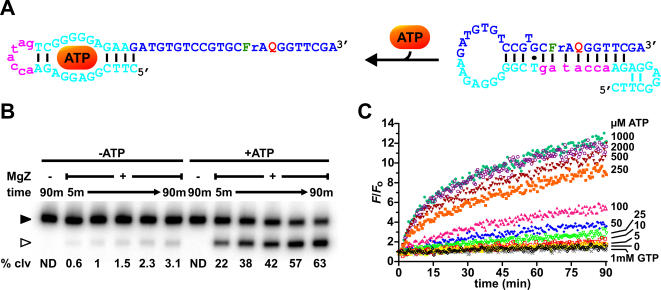
Most NAE (nucleic acid enzyme) sensors are composed of an RNA-cleaving catalytic motif and an aptameric receptor. They operate by activating or repressing the catalytic activity of a relevant NAE through the conformational change in the aptamer upon target binding. To transduce a molecular recognition event to a fluorescence signal, a fluorophore-quencher pair is attached to opposite ends of the RNA substrate such that when the NAE cleaves the substrate, an increased level of fluorescence can be generated. However, almost all NAE sensors to date harbor either NAEs that cannot accommodate a fluorophore-quencher pair near the cleavage site or those that can accept such a modification but require divalent transition metal ions for catalysis. Therefore, the signaling magnitude and the versatility of current NAE sensors might not suffice for analytical and biological applications. Here we report an RNA-cleaving DNA enzyme, termed 'MgZ', which depends on Mg(2+) for its activity and can accommodate bulky dye moieties next to the cleavage site. MgZ was created by in vitro selection. The selection scheme entailed acidic buffering and ethanol-based reaction stoppage to remove selfish DNAs. Characterization of MgZ revealed a three-way junction structure, a cleavage rate of 1 min(-1), and 26-fold fluorescence enhancement. Two ligand-responsive NAE sensors were rationally designed by linking an aptamer sequence to the substrate of MgZ. In the absence of the target, the aptamer-linked substrate is locked into a conformation that prohibits MgZ from accessing the substrate. In the presence of the target, the aptamer releases the substrate, which induces MgZ-mediated RNA cleavage. The discovery of MgZ and the introduction of the above NAE sensor design strategy should facilitate future efforts in sensor engineering.


Conflict of interest statement

Competing Interests: The authors have declared that no competing interests exist.

Figures

Figure 1
Figure 1
(A) In vitro selection scheme. The self-cleaving construct of the library consists of a DNA substrate (blue bars), 2 primer binding sites (open bars) and a random library (black bars). The substrate has one ribonucleotide, rA, flanked immediately by a fluorescein (F)- and a DABCYL (Q)-modified deoxyribothymidine. DNA species that are able to self-cleave in the presence of Mg2+ are isolated by denaturing PAGE and subsequently subjected to PCR- amplification. A ribo-linkage (rA) is introduced to the top strand of the PCR product during PCR 2, which enables the recovery of the DNAzyme strand after NaOH treatment followed by PAGE purification. To regenerate the self-cleaving construct, the DNA molecules are phosphorylated at the 5′ ends and ligated to the substrates. The selection cycle continues until a desired cleavage activity is reached. N represents A, G, C or T; P, phosphate. (B) MgZ in cis. Filled circles, absolutely conserved residues; Open bars, covariations; Filled triangle, cleavage site; Filled arrows, DMS methylation interfered residues; F, fluorescein-dT; Q, DABCYL-dT. Inset: random library in the self-cleaving construct (L) and the primers used (PM1-3). Substrate sequence is underlined.
Figure 2
Figure 2
(A) MgZ in trans. Shown here is a specific combination of substrate and MgZ variant that generates the largest signal enhancement upon substrate cleavage. (B) Kinetic analyses. □ refers to the left y-axis (% cleavage); ○, +(−Mg) and×(−MgZ) refer to the right y-axis (F/F o). The % cleavage vs. time data were fitted to Y = Y f(1–ekc t). Fitting-curve is shown as ---. Y, cleavage yield; Y f, final cleavage yield; k c, observed cleavage rate. The F/F o vs. time data were fitted to F/F o = initial F/F o+(final F/F o−initial F/F o)×(1−eks t); initial F/F o = 1.0. Fitting curve is shown as —. F/F o, fluorescence enhancement; k s, signal-enhancement rate. Cleavage rate = 1 min−1 with Yf = 91%. Signaling rate = 0.8-fold min−1 with final F/F o = 26-fold. Reaction condition: 5 nM substrate, 1 µM DNAzyme, 70 mM HEPES (pH 8.0), 40 mM MgCl2, 0.001% Tween-20, 30°C.
Figure 3
Figure 3. Sensor design and mechanism.
Blue, substrate; cyan, aptamer; magenta, antisense element. See text for details.
Figure 4
Figure 4. ATP sensor.
(A) ATP-ASAP. (B) Phosphorimage of the radioactive cleavage assays. Cleavage reactions were carried out with 5 nM ATP-ASAP, 50 nM MgZ and 1 mM ATP (in the case of ATP-induced cleavage) in 50 mM HEPES (pH 7.0), 20 mM MgCl2, 0.001% Tween-20 at room temperature. m, minutes; % clv, % cleavage; ND, not detectable; ▸, substrate; ▹, 5′ cleavage fragment. (C) Fluorescence kinetics in response to various concentrations of ligands. Similar reaction conditions in panel B were applied.
Figure 5
Figure 5. Initial rate of fluorescence enhancement vs. ATP concentration.
Fitting curve: v o = (v max×[ligand])/(K d+[ligand]). v o, initial rate of signal enhancement (see Materials and Methods); v max, maximal rate of signal enhancement; K d, dissociation constant. Error bar represents the standard deviation of three independent assays. v o with 2 mM ATP was omitted in the curve fitting process due to substantial fluorescence quenching by high [ATP] (Figure S10). Inset: v o vs. low [ATP].
Figure 6
Figure 6. ADP sensor.
(A) ADP-ASAP. (B) Phosphorimage of the radioactive cleavage assays. Cleavage reactions were carried out with 5 nM ADP-ASAP, 1 µM MgZ and 1 mM ADP (in the case of ADP-induced cleavage) in 50 mM HEPES (pH 7.0), 20 mM MgCl2, 0.001% Tween-20 at room temperature. ▸, substrate; ▹, 3′ cleavage fragment. (C) Fluorescence kinetics in response to various ADP concentrations. Similar reaction conditions in panel B were applied.
Figure 7
Figure 7. Sensitivity and specificity of ADP sensor.
(A) Initial rate of fluorescence enhancement vs. ADP concentration. Fitting curve: v o = (v max×[ligand])/(K d+[ligand]). Error bar: standard deviation of three independent assays. v o with 2 mM ADP was omitted in the curve fitting process due to fluorescence quenching by high [ADP] (Figure S10). Inset: v o vs. low [ADP]. (B) Fluorescence kinetics in response to non-cognate ligands. ado, adenosine; ×, 1 mM ado; +, 1 mM AMP; □, no ligand; ▵, 200 µM ATP; ▿, 300 µM ATP; ○, 400 µM ATP; •, 1 mM ATP.

References

    1. Robertson DL, Joyce GF. Selection in vitro of an RNA enzyme that specifically cleaves single-stranded DNA. Nature. 1990;344:467–468. - PubMed
    1. Ellington AD, Szostak JW. In vitro selection of RNA molecules that bind specific ligands. Nature. 1990;346:818–822. - PubMed
    1. Tuerk C, Gold L. Systematic evolution of ligands by exponential enrichment: RNA ligands to bacteriophage T4 DNA polymerase. Science. 1990;249:505–510. - PubMed
    1. Lee JF, Hesselberth JR, Meyers LA, Ellington AD. Aptamer Database. Nucleic Acids Res. 2004;32:D95–D100. - PMC - PubMed
    1. Thodima V, Piroozina M, Deng Y. RiboaptDB: A Comprehensive Database of Ribozymes and Aptamers. BMC Bioinformatics. 2006;7(Suppl. 2):S6. - PMC - PubMed

Publication types