. 2008 Apr;10(4):958-84.
doi: 10.1111/j.1462-5822.2007.01099.x. Epub 2007 Nov 20.

During infection of epithelial cells Salmonella enterica serovar Typhimurium undergoes a time-dependent transcriptional adaptation that results in simultaneous expression of three type 3 secretion systems

Affiliations

During infection of epithelial cells Salmonella enterica serovar Typhimurium undergoes a time-dependent transcriptional adaptation that results in simultaneous expression of three type 3 secretion systems

I Hautefort et al. Cell Microbiol. 2008 Apr.

Abstract

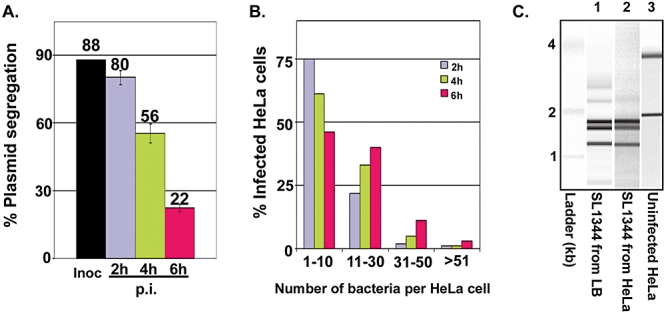
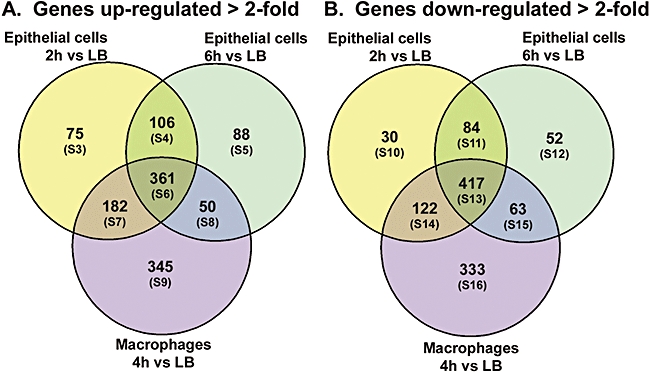
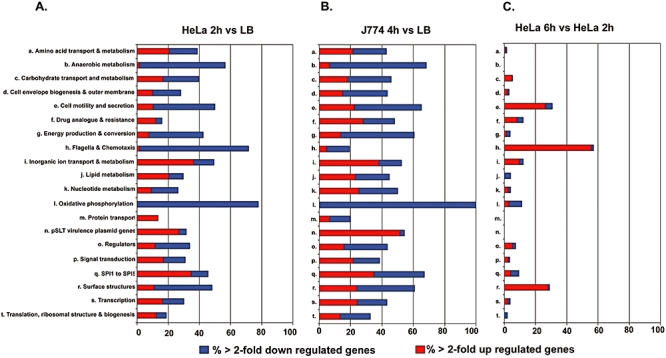
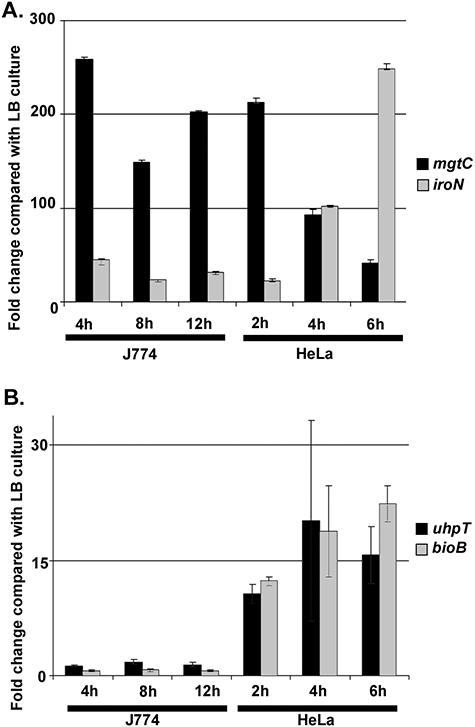
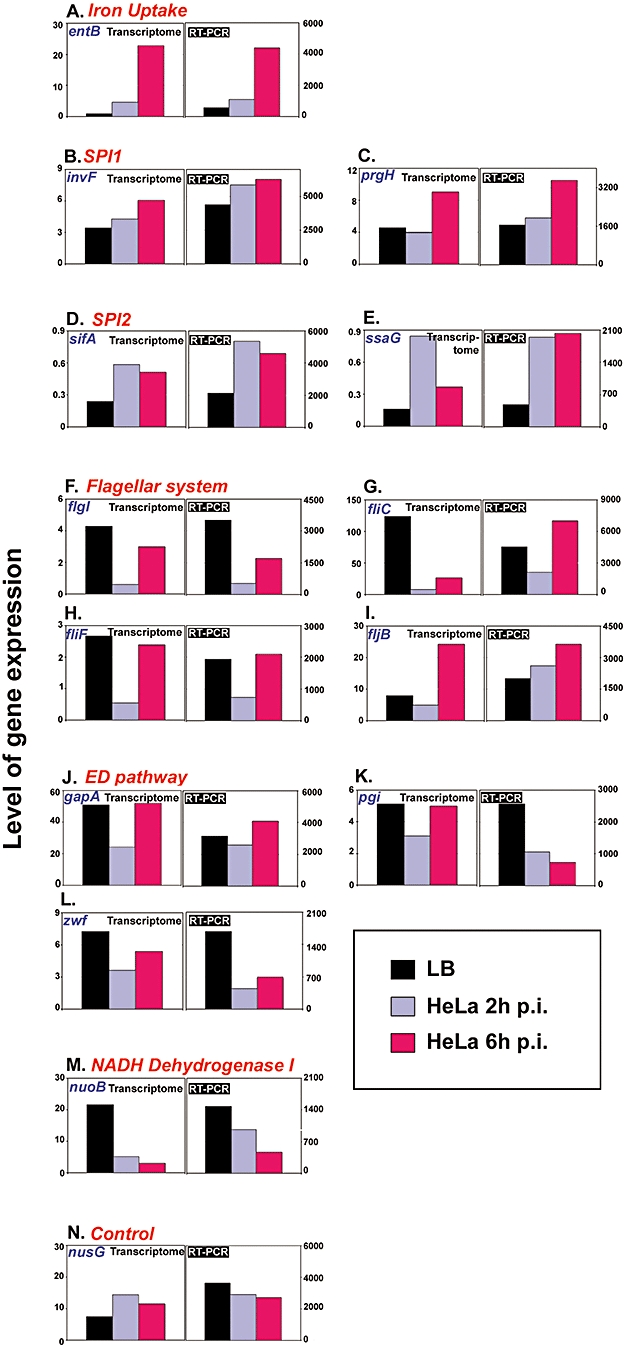
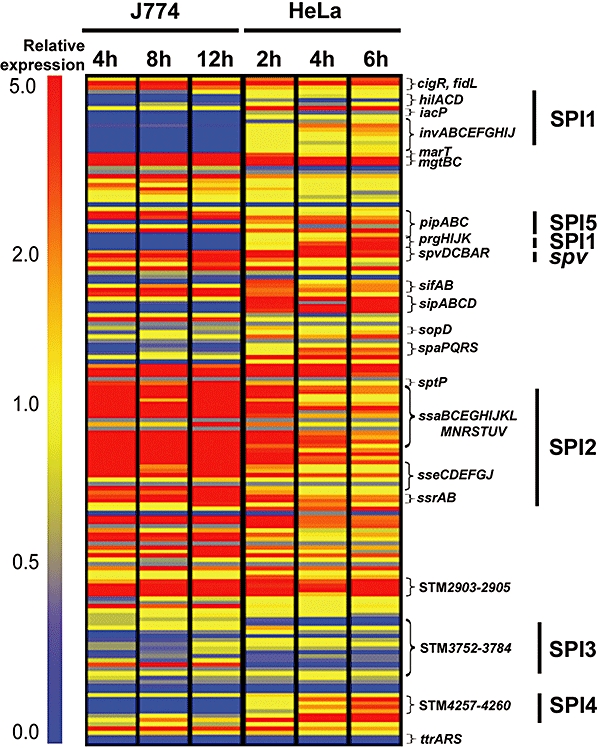
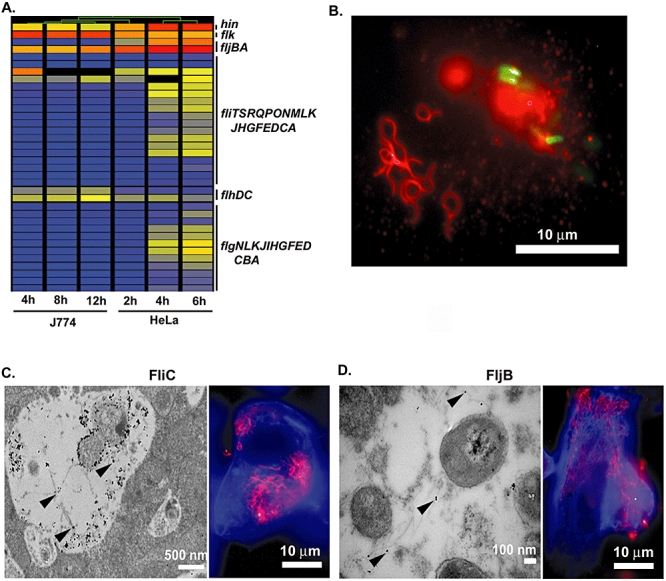
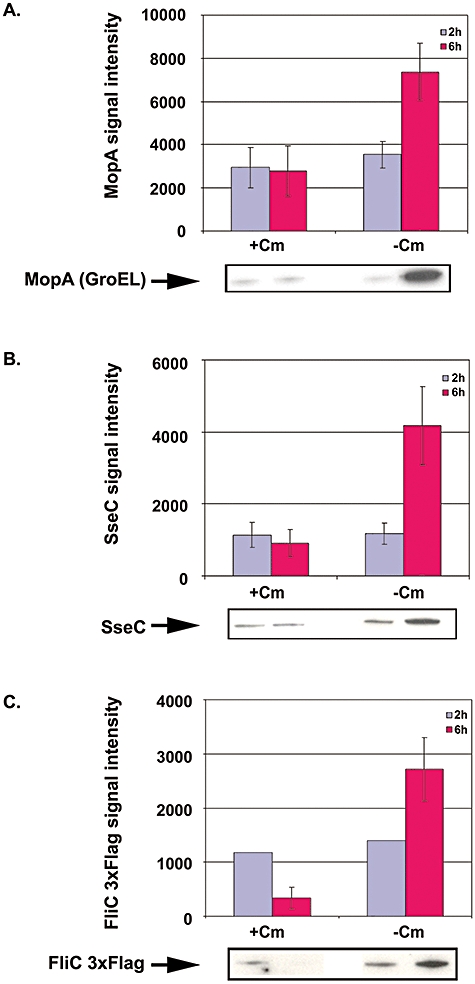
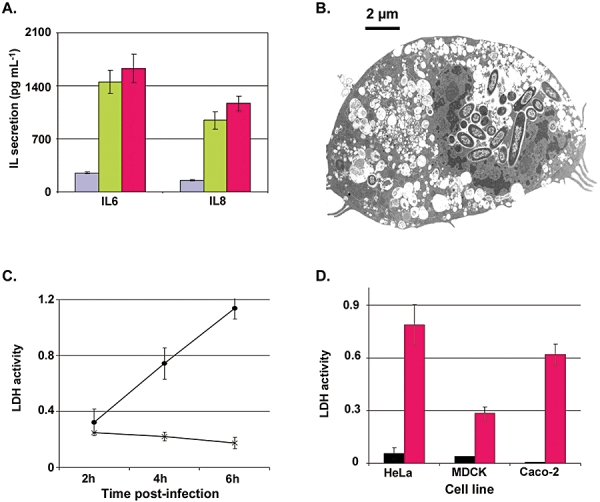
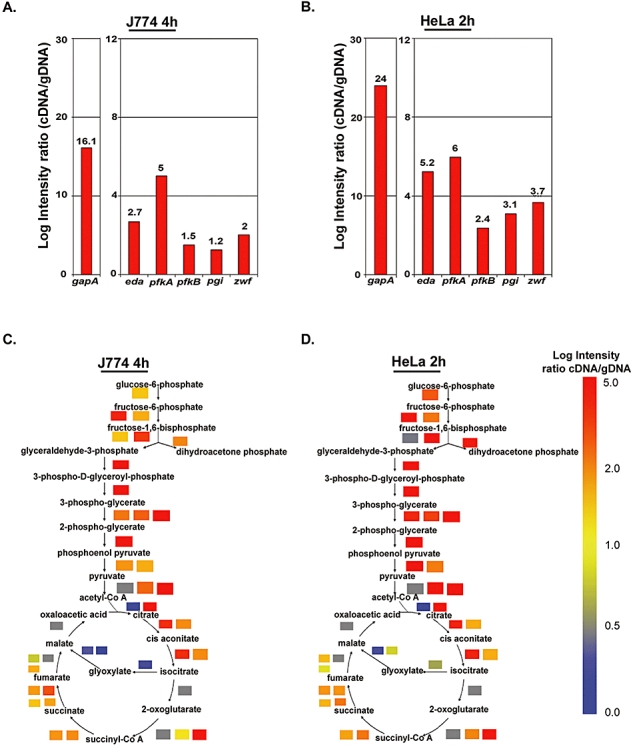
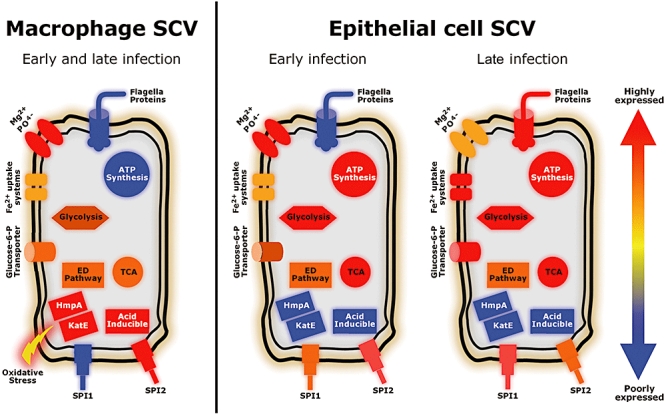
The biogenesis of the Salmonella-containing vacuole within mammalian cells has been intensively studied over recent years. However, the ability of Salmonella to sense and adapt to the intracellular environment of different types of host cells has received much less attention. To address this issue, we report the transcriptome of Salmonella enterica serovar Typhimurium SL1344 within epithelial cells and show comparisons with Salmonella gene expression inside macrophages. We report that S. Typhimurium expresses a characteristic intracellular transcriptomic signature in response to the environments it encounters within different cell types. The signature involves the upregulation of the mgtBC, pstACS and iro genes for magnesium, phosphate and iron uptake, and Salmonella pathogenicity island 2 (SPI2). Surprisingly, in addition to SPI2, the invasion-associated SPI1 pathogenicity island and the genes involved in flagellar biosynthesis were expressed inside epithelial cells at later stages of the infection, while they were constantly downregulated in macrophage-like cells. To our knowledge, this is the first report of the simultaneous transcription of all three Type Three Secretion Systems (T3SS) within an intracellular Salmonella population. We discovered that S. Typhimurium strain SL1344 was strongly cytotoxic to epithelial cells after 6 h of infection and hypothesize that the time-dependent changes in Salmonella gene expression within epithelial cells reflects the bacterial response to host cells that have been injured by the infection process.


Figures

Fig. 1
Fig. 1
Intracellular replication and distribution of S. Typhimurium SL1344 Salmonella strain inside epithelial cells. A. Bacterial replication was measured by following the segregation of the pPIR plasmid, which only replicates at 30°C. During each bacterial division at 37°C, only one daughter cell inherits the pPIR plasmid. Plasmid segregation is expressed as the percentage of bacterial cells that retain pPIR. The difference in percentage of bacterial cells carrying the pPIR plasmid inside epithelial cells between 2 and 6 h p.i. reflects a fourfold increase in the population level. Inoculum (Black), Epithelial cells 2 h p.i. (Purple), epithelial cells 4 h (Green) and epithelial cells 6 h (Magenta). B. Distribution of S. Typhimurium cells inside epithelial cells at 2, 4 and 6 h p.i.; values shown are the percentage of epithelial cells containing different numbers of bacteria observed by light microscopy (Experimental procedures). Epithelial cells 2 h p.i. (Purple), epithelial cells 4 h p.i. (Green) and epithelial cells 6 h p.i. (Magenta). Over 150 infected HeLa cells were examined. C. Isolation of high quality bacterial RNA from infected HeLa cells and separation by size chromatography (Experimental procedures). Total RNA was extracted from S. Typhimurium grown in LB medium in vitro (lane 1), S. Typhimurium from infected epithelial cells (lane 2) and eukaryotic RNA isolated from uninfected HeLa cells (lane 3).
Fig. 2
Fig. 2
Common intracellular transcriptomic signature and cell type specific responses of S. Typhimurium in epithelial cells and macrophages. Non-proportional Venn diagrams are shown. A. The S. Typhimurium genes significantly upregulated by at least twofold from epithelial (2 h p.i.), epithelial (6 h p.i.) and macrophage cells (4 h p.i.), all in comparison with LB. B. Genes significantly downregulated by at least twofold in the same samples. The common intracellular signature of S. Typhimurium is represented by the central area of each Venn diagram which contains genes that show similar patterns of regulation inside both types of mammalian cells (Tables S6 and S13). The Venn diagrams were also used to define lists of genes that were only upregulated or downregulated inside macrophages (Tables S9 and S16) or only inside epithelial cells (Tables S3–S5 and S10–S12).
Fig. 3
Fig. 3
Functional categories of S. Typhimurium genes changing in expression in epithelial cells and macrophages. The Red and Blue bars indicate the percentage of genes of each functional category upregulated or downregulated, respectively, inside epithelial cells (2 h p.i.) versus LB (A), or inside macrophages (4 h p.i.) versus LB (B). The classes of genes differentially regulated in epithelial cells at 6 h p.i. compared with the 2 h time point are shown in (C). The numbers of genes involved in each analysis are shown in Table 1. The list of genes included in each functional category was obtained from the Kyoto Encyclopedia of Genes and Genomes, KEGG (http://www.genome.jp/kegg/).
Fig. 4
Fig. 4
Selected S. Typhimurium genes that show differential expression between epithelial cells and macrophages. Transcriptomic data are shown for the S. Typhimurium mgtC and iroN genes (A), uhpT and bioB genes (B) inside both macrophage and epithelial cells. Data for the expression of specific genes are taken from Table S1. Error bars indicate the standard error of the mean.
Fig. 7
Fig. 7
RT-PCR confirmation of transcriptomic data. RNA was extracted from Salmonella cells released from infected epithelial cells at 2 and 6 h p.i. and from mid-exponential LB cultures, reverse transcribed to cDNA and used as template for RT-PCR amplification of entB (A), invF (B), prgH (C), sifA (D), ssaG (E), flgI (F), fliC (G), fliF (H), fljB (I), gapA (J), pgi (K), zwf (L), nuoB (M) and nusG (N) cDNAs using specific primers pairs (Table 5 and Experimental procedures). Each panel shows the expression levels observed from the transcriptomic data (graph on the left) and the RT-PCR analyses (graph on the right). Black bars show expression levels determined from LB culture. Purple and magenta bars show expression levels obtained inside epithelial cells at 2 and 6 h p.i. respectively.
Fig. 5
Fig. 5
SPI1 and SPI2 genes are upregulated inside epithelial cells. The expression profiles of SPI1 to SPI5 genes, their known effectors (Abrahams and Hensel, 2006; McClelland et al., 2001), and the spvABCDR virulence plasmid genes inside macrophage and epithelial cells are shown relative to the LB comparator. Each horizontal bar represents the expression level of a single gene. The post-infection sampling time is indicated. Blue shows that the gene is downregulated, yellow that it is expressed at similar levels and red that it is upregulated, compared with LB. Data are taken from Table S1, and are summarized in Table S2.
Fig. 6
Fig. 6
Expression of flagella by S. Typhimurium SL1344 inside epithelial cells. Cluster diagram of the expression profile of 36 flagella genes inside macrophage and epithelial cells, relative to the LB comparator (A). The colours are as Fig. 5A. Fluorescence micrograph shows polymerized flagella (red) separated from ssaG::gfp+ expressing JH3009 Salmonella cells (green) within epithelial cells at 6 h p.i. (B). Fluorescence and Transmission immunogold electron micrographs showing presence of FliC and FljB inside epithelial cells at 6 h p.i. (C, D). Flagella proteins were visualized with Anti-FliC (C) and Anti-FljB (D) antibodies. The arrow heads show immunogold labelling of FliC (C) and FljB (D) on TEM micrographs. The fluorescence micrographs in panels C and D show actin (blue) and large amounts of intracellular flagellin (magenta).
Fig. 8
Fig. 8
Confirmation of the de novo production of MopA, SseC and FliC 3xFlag by S. Typhimurium SL1344 inside epithelial cells. The levels of MopA (GroEL) (A), SseC (B) and 3xflag FliC (C) proteins detected at 2 h (purple) and 6 h (magenta) post infection in lysates of infected epithelial cells. De novo protein synthesis was assessed by treating intracellular bacterial cells with chloramphenicol and comparing protein levels with that of untreated intracellular bacteria. Experiments were performed in triplicate. The error bars indicate the SEM. For each protein, a representative example of the Western blot is given below the bar chart.
Fig. 9
Fig. 9
S. Typhimurium is cytotoxic to epithelial cells. Levels of IL-6 and IL-8 secreted by HeLa cells infected with SL1344 were measured by flow cytometry (Experimental procedures). Levels of secreted IL from epithelial cells at 2 h (purple), 4 h (green) and 6 h (magenta) post infection (A). Error bars in panels A, C and D show SEM. Transmission electron micrograph showing a dying epithelial cell at 6 h post infection which was representative of 70% of the infected epithelial cell sections that were observed (B). Cytotoxic effect of SL1344 strain (closed circle) on epithelial cells after 2, 4 and 6 h infection compared to non-infected cells (cross) (C). All cytotoxicity data were obtained from three independent replicates. Cytotoxic effect of SL1344 strain on HeLa, MDCK and Caco-2 epithelial cell lines. Black bars show LDH levels obtained on uninfected epithelial cells. Magenta bars show the LDH levels obtained on infected epithelial cells after 6 h infection (D).
Fig. 10
Fig. 10
The S. Typhimurium TCA cycle, Entner–Doudoroff and Glycolytic pathways are more active inside epithelial cells than macrophage cells. Panels A and B show expression levels of S. Typhimurium genes involved in the Entner–Doudoroff pathway inside macrophages at 4 h p.i. (A) and inside epithelial cells at 2 h p.i. (B). These bar charts show the approximate level of each mRNA from the un-normalized transcriptomic data set. C and D show colour-coded expression levels for genes involved in each step of the S. Typhimurium glycolysis and TCA pathways. This figure does not involve normalization to a comparator but uses transcriptomic data to show the approximate level of each mRNA from the non-normalized Log intensity ratios between cDNA and genomic reference DNA. Each coloured block refers to a specific gene that encodes a relevant enzyme involved in particular metabolic pathways. Red indicates that the gene is highly expressed, yellow that the gene is expressed at intermediate levels, blue that the gene is poorly expressed and grey that no data were available for that gene. Panel C shows the gene expression data from Salmonella isolated from macrophages (4 h p.i.) and (D) data obtained from Salmonella isolated from epithelial cells (2 h p.i.). Key differences can be seen by comparing particular coloured blocks across C and D.
Fig. 11
Fig. 11
Model proposed for the responses of Salmonella Typhimurium to the intracellular environment of macrophages and epithelial cells. The response of S. Typhimurium to the macrophage SCV is relatively stable by 4 h p.i. and hardly varies at later time points. Conversely, the epithelial SCV changes through time, probably because Salmonella responds to alterations in the epithelial cells from the early to the late stages of infection. Each symbol represents groups of functionally related proteins and is coloured according to expression levels of the appropriate genes under each condition.

Similar articles

Cited by

References

    1. Abrahams GL, Hensel M. Manipulating cellular transport and immune responses: dynamic interactions between intracellular Salmonella enterica and its host cells. Cell Microbiol. 2006;8:728–737. - PubMed
    1. Achtman M, Heuzenroeder M, Kusecek B, Ochman H, Caugant D, Selander RK, et al. Clonal analysis of Escherichia coli O2: K1 isolated from diseased humans and animals. Infect Immun. 1986;51:268–276. - PMC - PubMed
    1. Akerley BJ, Monack DM, Falkow S, Miller JF. The bvgAS locus negatively controls motility and synthesis of flagella in Bordetella bronchiseptica. J Bacteriol. 1992;174:980–990. - PMC - PubMed
    1. Allen A. The Structure and Function of Gastrointestinal Mucous. Boca Raton, FL: CRC Press; 1984.
    1. Alpuche Aranda CM, Swanson JA, Loomis WP, Miller SI. Salmonella typhimurium activates virulence gene transcription within acidified macrophage phagosomes. Proc Natl Acad Sci USA. 1992;89:10079–10083. - PMC - PubMed

Publication types

MeSH terms

Substances