. 2007 Nov 21;56(4):689-700.
doi: 10.1016/j.neuron.2007.09.030.

Retinal adaptation to object motion

Affiliations

Retinal adaptation to object motion

Bence P Olveczky et al. Neuron. .

Abstract

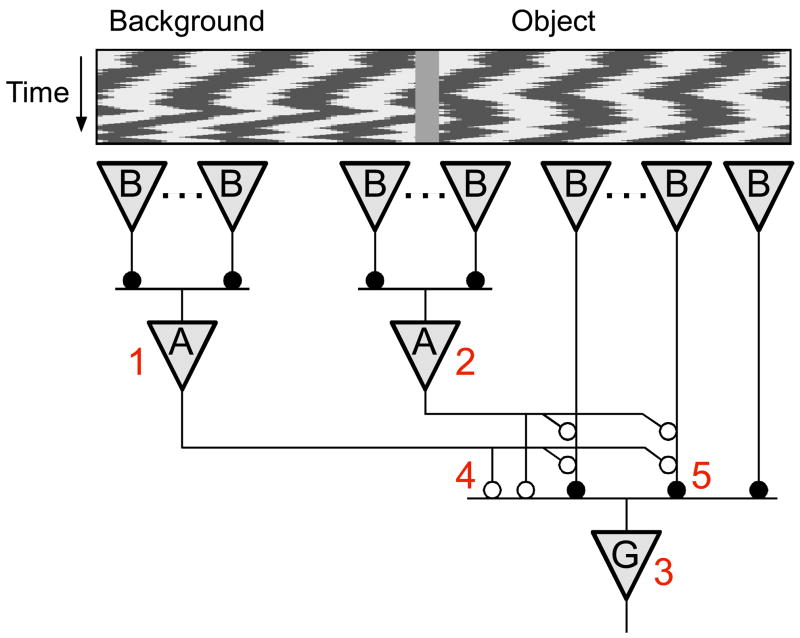
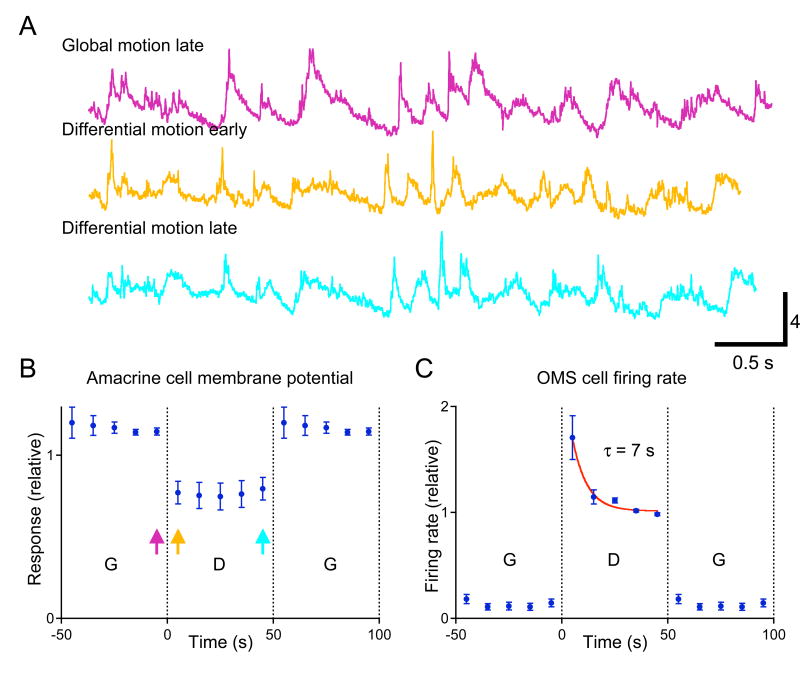
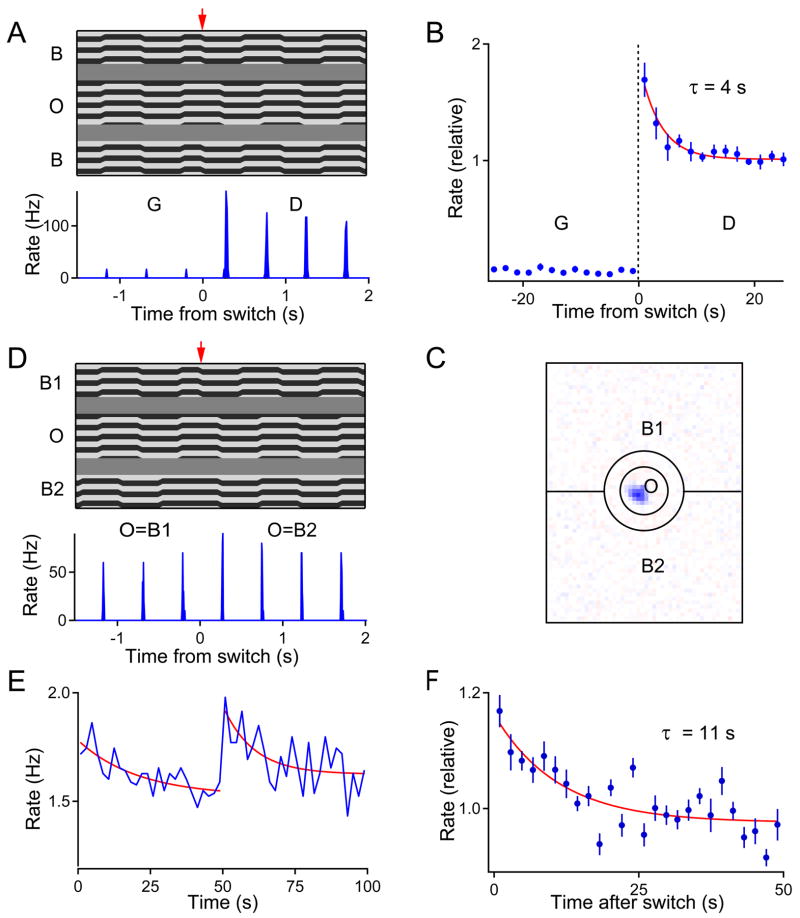
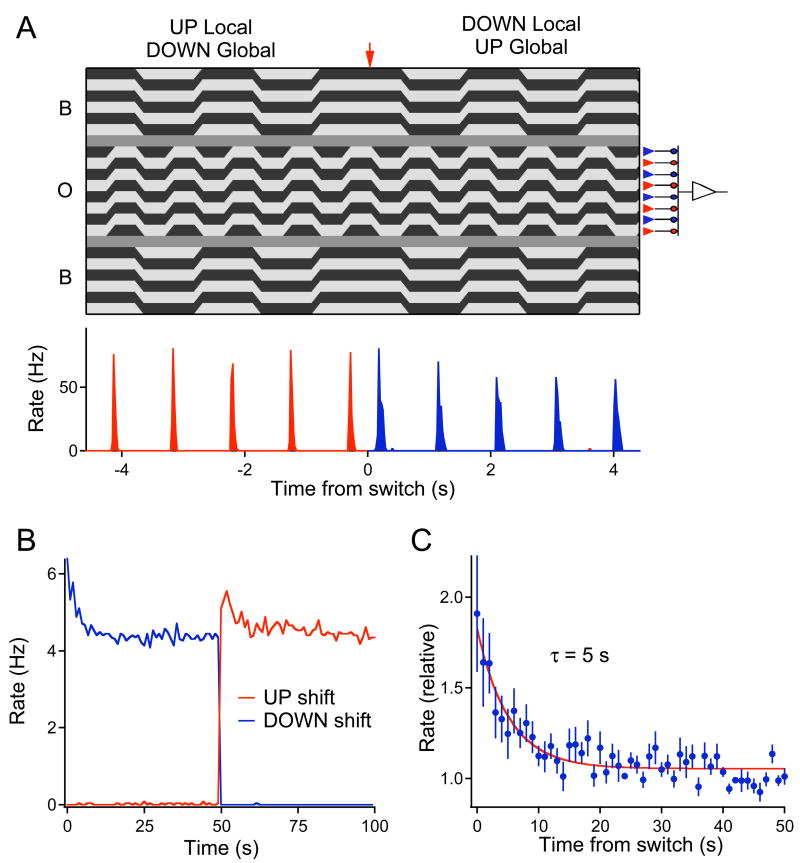
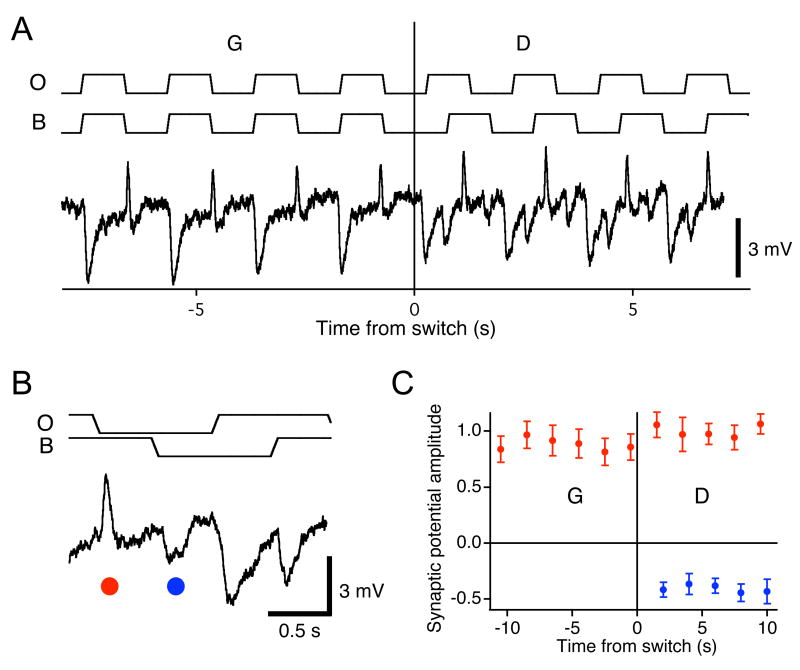
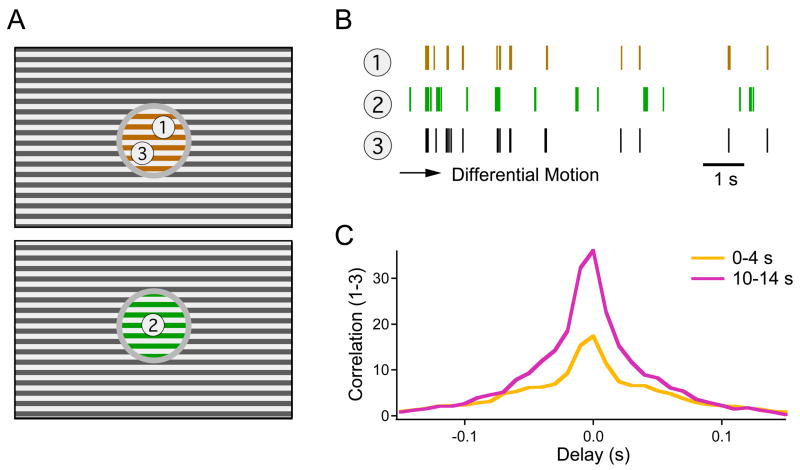
Due to fixational eye movements, the image on the retina is always in motion, even when one views a stationary scene. When an object moves within the scene, the corresponding patch of retina experiences a different motion trajectory than the surrounding region. Certain retinal ganglion cells respond selectively to this condition, when the motion in the cell's receptive field center is different from that in the surround. Here we show that this response is strongest at the very onset of differential motion, followed by gradual adaptation with a time course of several seconds. Different subregions of a ganglion cell's receptive field can adapt independently. The circuitry responsible for differential motion adaptation lies in the inner retina. Several candidate mechanisms were tested, and the adaptation most likely results from synaptic depression at the synapse from bipolar to ganglion cell. Similar circuit mechanisms may act more generally to emphasize novel features of a visual stimulus.


Figures

Figure 1
Figure 1. Object motion sensitive (OMS) ganglion cells adapt their response to differential motion
(A) Receptive field profile of an OMS (salamander Fast OFF) ganglion cell. (B) A stripe grating representing an object was projected in and around the cell’s receptive field center, while the remainder of the retina was presented with a background grating. (C) Time course of the gratings plotted along a vertical transect of the display (vertical line in panel B), illustrating the stimuli for Global Motion, Differential Motion, and Local Motion. For clarity, the number of grating bars has been reduced and only 5 seconds are shown for each stimulus condition. The transitions are marked by arrows. (D) Average firing rate of the OMS cell in (A) to 50 successive trials of a stimulus alternating between Global Motion and Differential Motion every 40 s. (E) Firing rate of another OMS cell under alternating Global and Local Motion.
Figure 2
Figure 2. Recovery from differential motion adaptation
(A) Firing rate of an OMS cell in response to a stimulus alternating between 40 s of Differential Motion (D) and a varying interval of Global Motion (G). (B) Firing rate at the onset of Differential Motion relative to the final value, plotted as a function of the preceding duration of Global Motion.
Figure 3
Figure 3. Neural circuitry underlying object motion sensitivity
The OMS ganglion cell (G) receives excitatory input through rectifying synapses from multiple bipolar cells (B). OMS cells are inhibited both directly and indirectly by amacrine cells (A). Numbers represent sites potentially involved in differential motion adaptation. 1 – The inhibitory surround region. 2 – A polyaxonal amacrine cell spanning object and background regions. 3 – The OMS cell. 4 – The inhibitory synapse from amacrine cells to the OMS ganglion cell. 5 – The excitatory synapse from bipolar cells to the OMS ganglion cell.
Figure 4
Figure 4. Polyaxonal amacrine cells do not adapt to differential motion
(A) Membrane potential response of a polyaxonal amacrine cell to the same object trajectory during different phases of the stimulus; see corresponding arrows in (B). The object region experienced a 10-s random motion trajectory, repeated identically every 10 s. The background region alternated between Global and Differential Motion every 50 s (see Methods). (B) Standard deviation in the membrane potential of a polyaxonal amacrine cell under switching between Global and Differential Motion. Response averaged over 4 trials of the same stimulus normalized by the standard deviation over the entire response. (C) The average firing rate of 6 OMS cells in this retina under the same stimulus.
Figure 5
Figure 5. OMS ganglion cell response does not change during global motion
(A) Membrane potential response of an OMS ganglion cell to the same object trajectory during different phases of the stimulus; see corresponding arrows in (B). The object region experienced a 5-s random motion trajectory, repeated identically every 5 s. The background region alternated between Global and Differential Motion every 50 s. (B) Response of an OMS ganglion cell to the differential motion onset stimulus: firing rate (left axis) and standard deviation of the subthreshold membrane potential (right axis). Note the adaptation in response to differential motion, but the lack of recovery during global motion. This could be explained if the OMS cell receives two types of bipolar cell input: The dotted line indicates a hypothetical component that is identical under Global and Differential Motion; the dashed line denotes a component that is active only during Differential Motion and declines in strength (see text for detail). Baseline noise of 0.81 mV has been subtracted from the membrane potential fluctuations to yield the stimulus-driven response.
Figure 6
Figure 6. Differential motion adaptation happens before spatial summation of the surround
(A–B) A simplified differential motion onset stimulus elicits similar response in OMS ganglion cells as the random jitter stimulus (Figure 1). (A) Top: Motion trajectories for the ‘grating shift’ stimulus, presented as in Figure 1C. An object grating (O) and a background grating (B) shifted back and forth 13 μm every 0.5 s. The gratings shifted in synchrony for Global Motion (G) and in alternation for Differential Motion (D). The arrow marks the switch between the two conditions. Bottom: Firing rate of an OMS cell in response to the above stimulus. Average over 30 trials. (B) Responses to this stimulus averaged over 12 OMS cells. Each data point reflects the firing during 2 successive grating shifts. (C) Outline of the ‘split surround’ stimulus, drawn on the receptive field of an OMS ganglion cell. Again a circular object region (O) covered the receptive field center. The background was divided into two halves, B1 and B2. All 3 regions were painted with striped gratings (not shown). (D) Top: Motion trajectories for the ‘split surround’ stimulus. One of the background regions stepped in synchrony with the object, the other in alternation. Every 50 s the two regions swapped roles. This transition is marked by the arrow. The step size was 27 μm. Bottom: Firing rate of an OMS cell in response to this stimulus. Average over 20 trials. (E) Response of an OMS cell to the ‘split surround’ stimulus averaged across 20 trials. Each data point reflects the firing during 2 successive grating shifts. (F) Responses averaged over 4 OMS cells and both phases of the stimulus.
Figure 7
Figure 7. Differential motion adaptation happens before spatial summation of the center
(A) Top: Stimulus designed to probe adaptation at the bipolar cell terminals. The object grating shifted back and forth by one bar width (67 μm) at 2 Hz. The background grating shifted at 1 Hz, in synchrony with the downward shifts of the object grating; 50 s later, the background switched phase to synchronize with upward shifts of the object. The transition is marked by the arrow. A simplified circuit diagram (right) illustrates how the up- and down-shifts of the object grating drive two distinct populations of bipolar cells, thereby separating their inputs to the ganglion cell in time. Bottom: Firing rate of an OMS cell in response to the above stimulus. Average over 30 trials. (B) Response of an OMS ganglion cell to the stimulus in (A) averaged over 30 trials. Each data point reflects the average firing rate during one shift of the object grating. In the interval 0–50 s the background shifts coincided with upward object shifts, in 50–100 s with downward object shifts. (C) Responses averaged over 12 OMS cells and both phases of the stimulus.
Figure 8
Figure 8. No adaptation in the bipolar cell response
(A) Membrane potential of an OFF bipolar cell under the periodic shift stimulus of Figure 6A. Average of 3 traces. The receptive field was centered on the object region. Stimulus traces indicate movement of the object (O) and background (B). (B) Enlargement of the trace illustrating excitatory and inhibitory potentials triggered by the grating shifts. (C) The amplitude of the excitatory (red) and inhibitory (blue) potentials marked in panel B as a function of time relative to the switch to Differential Motion. Recordings were obtained from 7 bipolar cells and normalized by the average EPSP during differential motion.
Figure 9
Figure 9. Adaptation increases the correlation between OMS cells that view the same object
(A) Scenario with two moving objects following different trajectories (represented by different colors) and an independently jittered background. (B) Spike trains recorded from three OMS cells, two of them (1 and 3) seeing the same motion trajectory. In the course of adaptation to Differential Motion, the firing events gradually become sparser. (C) Cross-correlation function between the spike trains of two cells viewing the same object (see Methods). This represents the rate of spike coincidences at a given delay, divided by the spurious rate of such coincidences if the same cells were driven by independent objects.

References

    1. Abrams RA, Christ SE. Motion onset captures attention. Psychol Sci. 2003;14:427–432. - PubMed
    1. Aizenman CD, Huang EJ, Manis PB, Linden DJ. Use-dependent changes in synaptic strength at the Purkinje cell to deep nuclear synapse. Prog Brain Res. 2000;124:257–273. - PubMed
    1. Baccus SA, Meister M. Fast and slow contrast adaptation in retinal circuitry. Neuron. 2002;36:909–919. - PubMed
    1. Barlow HB. A theory about the functional role and synaptic mechanism of visual after-effects. In: Blakemore C, editor. Vision: Coding and Efficiency. Cambridge: Cambridge University Press; 1990. pp. 363–375.
    1. Barlow HB, Hill RM. Evidence for a physiological explanation of the waterfall phenomenon and figural after-effects. Nature. 1963;200:1345–1347. - PubMed

Publication types

MeSH terms

LinkOut - more resources