. 2008 Jan;18(1):1-12.
doi: 10.1101/gr.6831208. Epub 2007 Nov 21.

A code for transcription initiation in mammalian genomes

Affiliations

A code for transcription initiation in mammalian genomes

Martin C Frith et al. Genome Res. 2008 Jan.

Abstract

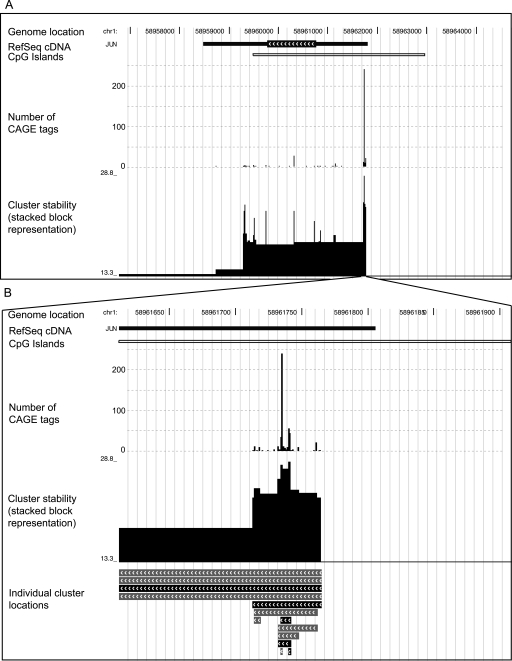
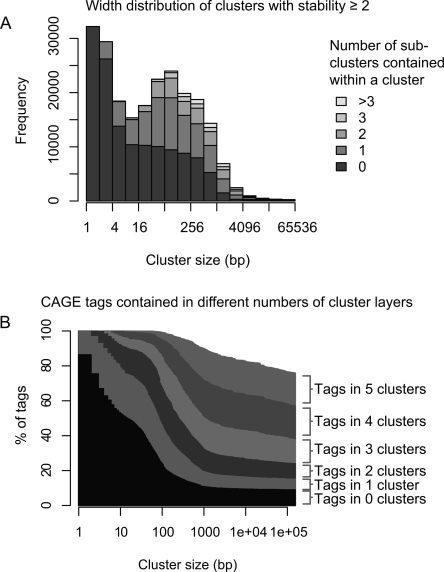
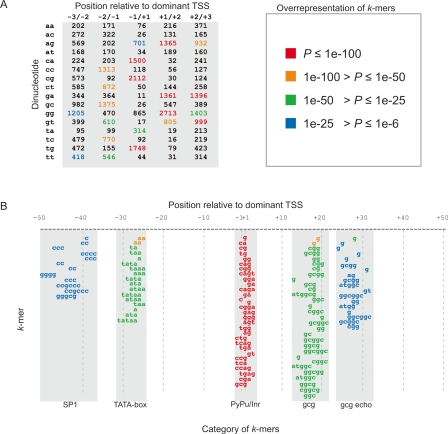
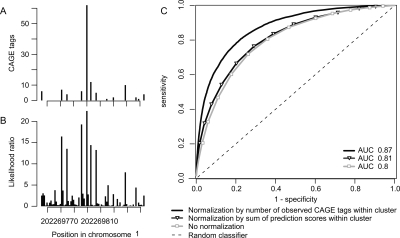
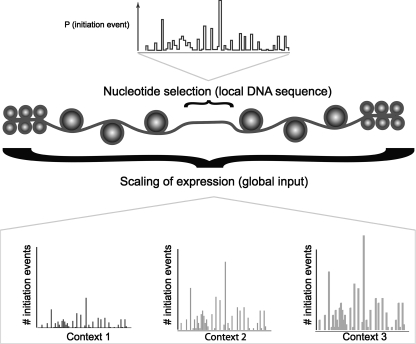
Genome-wide detection of transcription start sites (TSSs) has revealed that RNA Polymerase II transcription initiates at millions of positions in mammalian genomes. Most core promoters do not have a single TSS, but an array of closely located TSSs with different rates of initiation. As a rule, genes have more than one such core promoter; however, defining the boundaries between core promoters is not trivial. These discoveries prompt a re-evaluation of our models for transcription initiation. We describe a new framework for understanding the organization of transcription initiation. We show that initiation events are clustered on the chromosomes at multiple scales-clusters within clusters-indicating multiple regulatory processes. Within the smallest of such clusters, which can be interpreted as core promoters, the local DNA sequence predicts the relative transcription start usage of each nucleotide with a remarkable 91% accuracy, implying the existence of a DNA code that determines TSS selection. Conversely, the total expression strength of such clusters is only partially determined by the local DNA sequence. Thus, the overall control of transcription can be understood as a combination of large- and small-scale effects; the selection of transcription start sites is largely governed by the local DNA sequence, whereas the transcriptional activity of a locus is regulated at a different level; it is affected by distal features or events such as enhancers and chromatin remodeling.


Figures

Figure 1.
Figure 1.
Multiple-scale clustering of transcription initiation events. (A) Clustering of transcription initiation events in a 9-kb region around the JUN oncogene in human chromosome 1. (B) Zoom-in on the main JUN promoter region. Each panel displays genomic features with a representation similar to that used by the UCSC Genome Browser (Kent et al. 2002). Different types of features are shown in different “tracks,” stacked from top to bottom in each panel. The topmost track shows the location in chromosome 1. Below this, the next track indicates the location of the single-exon JUN gene, according to RefSeq cDNAs in the UCSC database (Karolchik et al. 2003); the thicker part with chevrons is the protein-coding region, and the thinner parts are the 5′ and 3′ untranslated regions. Transcription is directed right-to-left. CpG island regions are shown below. The CAGE track (the first barplot) shows the number of CAGE tags initiating from each nucleotide. There is clearly a cluster of initiation events roughly covering the JUN gene, contrasted with a striking absence of initiation events on either side of the gene. Furthermore, this cluster clearly contains a much denser subcluster in the annotated promoter region, and the subcluster seems to contain a core region with an even greater density of initiation events (B). The clusters track (B, bottom) shows the clusters in the CAGE data picked out by our algorithm. Stable clusters (stability ≥2) are black and unstable clusters are gray. Only clusters >1 nt are shown in this track. For some of the clusters in this track, we only see one of their ends, as they extend further in the 3′ direction. Finally, the cluster-stability track shows these same clusters as blocks that are stacked on each other, where the height of each block reflects the cluster’s stability. (In fact, the logarithm of the d parameter from our algorithm is plotted on the Y-axis, so that the height of each block is proportional to the logarithm of the cluster’s stability. See the main text and Methods for definitions of stability and d.)
Figure 2.
Figure 2.
Properties of transcription initiation clusters. (A) Size distribution and numbers of subclusters. Clusters were binned according to their size, and the number of clusters in each size bin is plotted as a histogram. Within each size bin, the clusters are subdivided according to how many subclusters they contain (not counting sub-sub-clusters, etc). (B) Percentage of CAGE tags contained in multiple layers of clusters within clusters. The fraction of tags contained within 0, 1, or more clusters is shown for varying cluster sizes (X-axis); when only small clusters are considered, most tags are isolated, but when large clusters are considered, most tags lie in multiple layers of clusters. In both panels, only stable clusters (stability ≥2) are considered.
Figure 3.
Figure 3.
Overlap of transcription initiation clusters from different cell lines. (A) Overlap between clusters from skin fibroblasts (HBM library) and clusters from HepG2 cells (HBY library). (B) Overlap between clusters from skin fibroblasts (HBM library) and clusters from cerebrum (HAM library). If two clusters overlap, the degree of overlap is measured as the number of nucleotides in the intersection of the clusters divided by the number of nucleotides in the union of the clusters. This value varies between one (perfect overlap) and zero (no overlap). Since we are dealing with nested hierarchies of clusters, it is not appropriate to compare every cluster from one cell line with all overlapping clusters in the other cell line. In each panel, the first mentioned library is designated as the “query,” and the second as the “reference.” For each query cluster, we wish to know whether there is a closely corresponding reference cluster. Only robust query clusters are considered, i.e., those with stability ≥2. For each query cluster, we find the reference cluster with the highest degree of overlap, and report this value. If there is no overlapping reference cluster, an overlap value of zero is reported. Cases with an intermediate degree of overlap are often caused by single, outlying CAGE tags that shift the cluster boundary in one library.
Figure 4.
Figure 4.
A code for transcription initiation. (A) Dinucleotide frequencies at fixed distances from dominant transcription start sites in HepG2 cells. Dinucleotide counts in the −3/+3 region around 7734 transcription start sites are shown as a table. These frequencies are highly non-random; each dinuceotide has a P-value describing its over-representation, where low P-values correspond to high over-representation. Dinucleotides are shaded by colors according to the P-value range they belong to, where red and blue represent the most and least significant categories, respectively (see legend at right of table). In general, oligonucleotide frequencies in the −50/+50 region constitute a code for TSS selection. The most frequent motifs in this region are shown in B. (B) Over-represented k-mers at fixed distances from dominant transcription start sites in HepG2 cells. This is a graphical representation of the same type of data as in A, but extended to all over-represented DNA words (or k-mers) in the −50 to +50 region around dominant transcription start sites. Statistically over-represented k-mers are displayed at the positions where they occur relative to the dominant TSS, whose first transcribed nucleotide is at +1. As in A, k-mers are colored according to their over-representation P-value. From left to right, the word columns can be described as SP1-like (at –50/−37), TATA-box (−32/−25), Inr/Pyrimidine-Purine (−2/+3), gcg-motif (+12/+21), and gcg echo (+25/+32). Each column (motif) is sorted by P-values independently of the other columns; for instance, the words in the Inr column are all more significantly over-represented than those in the gcg column. See Supplemental Figure S2 with legend for a more detailed description of each motif with corresponding statistics, sorted by overall P-value, and Supplemental Figures S3–S7 for corresponding figures using other cell lines from human and mouse.
Figure 5.
Figure 5.
Predicting TSS usage. (A) Observed TSS usage in a TSS cluster at the start of the MFSD4 gene. The number of CAGE tags (from all libraries) initiating from each nucleotide is shown as a bar plot. This is for comparison with the predicted initiation propensity in the next panel. (B) Predicted TSS propensity of each nucleotide in the above TSS cluster. The transcription initiation propensity of each nucleotide, calculated as a likelihood ratio predicted from the surrounding DNA sequence using a second-order Markov model (see main text and Methods), is shown as a bar plot. Note the high correlation between predicted rates in this panel and the observed counts in A. (C) Classification of nucleotides within TSS clusters as active or inactive. The receiver operating characteristic (ROC) curve plots sensitivity vs. specificity (see Methods) for classification methods. The area under the curve (AUC) statistic is shown within the plot for the different prediction methods. An AUC of 100% corresponds to ideal performance, while a random classifier (shown as a dotted line) will have an AUC of 50%. We use the prediction scores, as exemplified in B, to classify each nucleotide in a cluster as active or inactive, for the test clusters on chromosome 1. With no additional scaling of these scores, the predictive power is adequate (gray line with boxes). Normalizing the nucleotide scores by the sum of prediction scores within the cluster (black line with triangles) does not improve the prediction. However, after scaling the prediction scores by the overall expression level (number of observed CAGE tags) of the cluster (black line), the AUC reaches an impressive 87%. Thus, knowing the expression output of a given promoter region adds additional predictive power.
Figure 6.
Figure 6.
A general model for the organization of transcription initiation. The underlying propensity for initiation of transcription by the RNA polymerase II enzyme is governed solely by local DNA sequence. The role of processes working distally (such as enhancers) or at larger scales is to stabilize the initiation process or regulate DNA accessibility. The global features can be viewed as a way to scale the underlying TSS selection distribution; these features can change due to context, while the local DNA code cannot. “Context” encompasses both distal DNA elements/chromatin state events and the state of the cell (e.g., which transcription factors are present). The total expression output from a TSS cluster is a product of the local and global factors.

References

    1. Akobeng A.K. Understanding diagnostic tests 3: Receiver operating characteristic curves. Acta Paediatr. 2007;96:644–647. - PubMed
    1. Bajic V.B., Tan S.L., Suzuki Y., Sugano S., Tan S.L., Suzuki Y., Sugano S., Suzuki Y., Sugano S., Sugano S. Promoter prediction analysis on the whole human genome. Nat. Biotechnol. 2004;22:1467–1473. - PubMed
    1. Bajic V.B., Brent M.R., Brown R.H., Frankish A., Harrow J., Ohler U., Solovyev V.V., Tan S.L., Brent M.R., Brown R.H., Frankish A., Harrow J., Ohler U., Solovyev V.V., Tan S.L., Brown R.H., Frankish A., Harrow J., Ohler U., Solovyev V.V., Tan S.L., Frankish A., Harrow J., Ohler U., Solovyev V.V., Tan S.L., Harrow J., Ohler U., Solovyev V.V., Tan S.L., Ohler U., Solovyev V.V., Tan S.L., Solovyev V.V., Tan S.L., Tan S.L. Performance assessment of promoter predictions on ENCODE regions in the EGASP experiment. Genome Biol. 2006;7:S1–S3. doi: 10.1186/gb-2006-7-S1-S3. - DOI - PMC - PubMed
    1. Barrera L.O., Ren B., Ren B. The transcriptional regulatory code of eukaryotic cells - insights from genome-wide analysis of chromatin organization and transcription factor binding. Curr. Opin. Cell Biol. 2006;18:291–298. - PubMed
    1. Blake M.C., Jambou R.C., Swick A.G., Kahn J.W., Azizkhan J.C., Jambou R.C., Swick A.G., Kahn J.W., Azizkhan J.C., Swick A.G., Kahn J.W., Azizkhan J.C., Kahn J.W., Azizkhan J.C., Azizkhan J.C. Transcriptional initiation is controlled by upstream GC-box interactions in a TATAA-less promoter. Mol. Cell. Biol. 1990;10:6632–6641. - PMC - PubMed

Publication types

Substances