. 2008 May 6;70(19 Pt 2):1740-52.
doi: 10.1212/01.wnl.0000281688.77598.35. Epub 2007 Nov 21.

Atrophy rates accelerate in amnestic mild cognitive impairment

Affiliations

Atrophy rates accelerate in amnestic mild cognitive impairment

C R Jack Jr et al. Neurology. .

Abstract

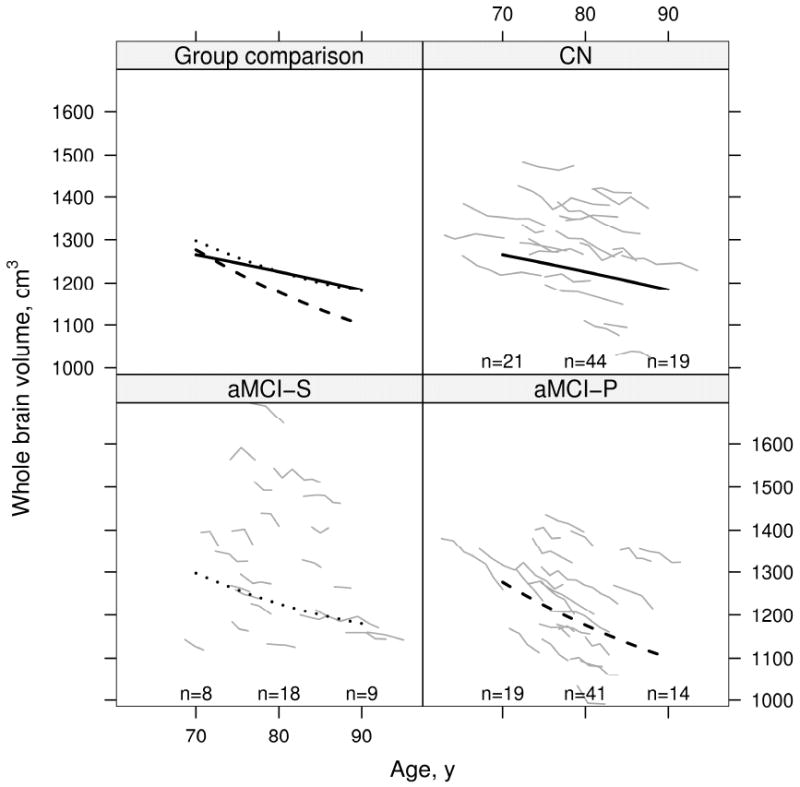
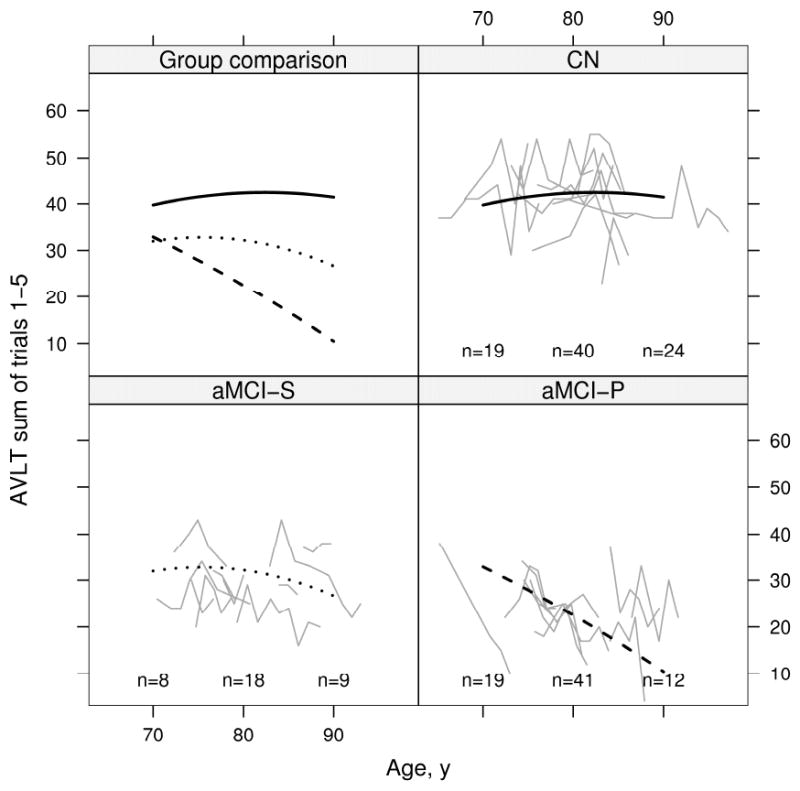
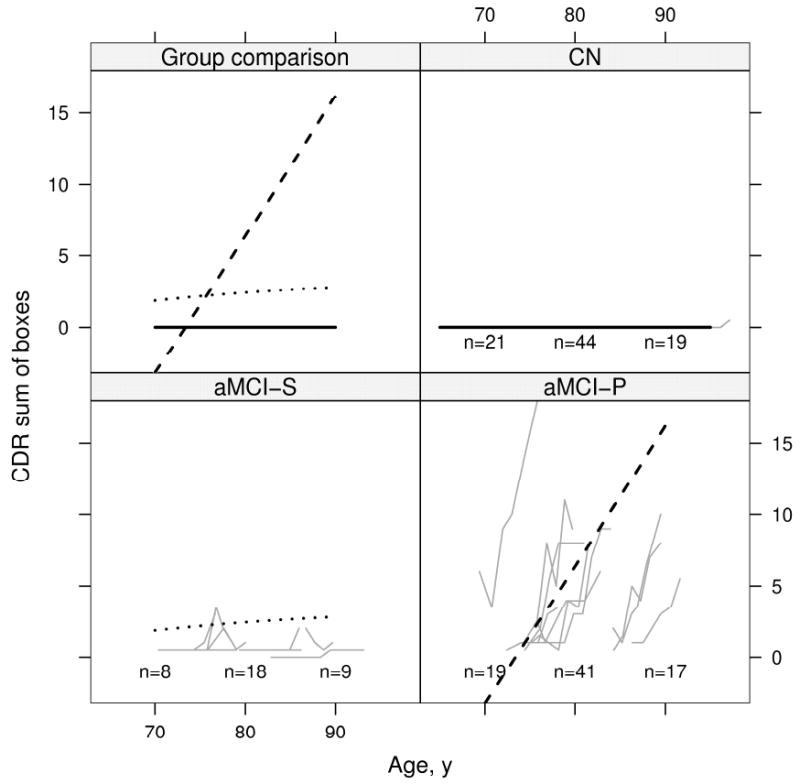
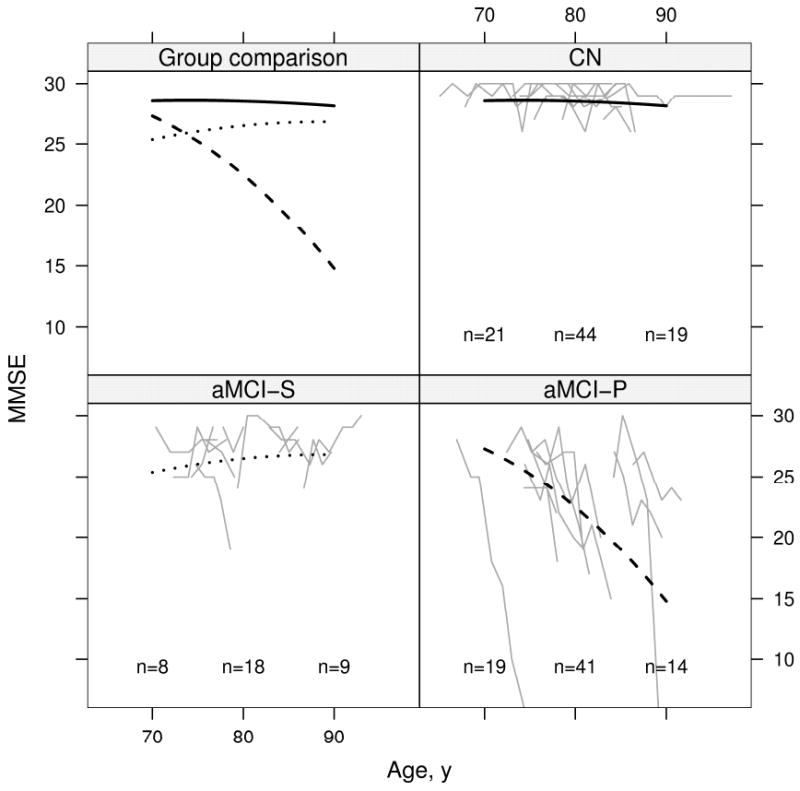
Background: We tested if rates of brain atrophy accelerate in individuals with amnestic mild cognitive impairment (aMCI) as they progress to typical late onset Alzheimer disease (AD). We included comparisons to subjects with aMCI who did not progress (labeled aMCI-S) and also to cognitively normal elderly subjects (CN).

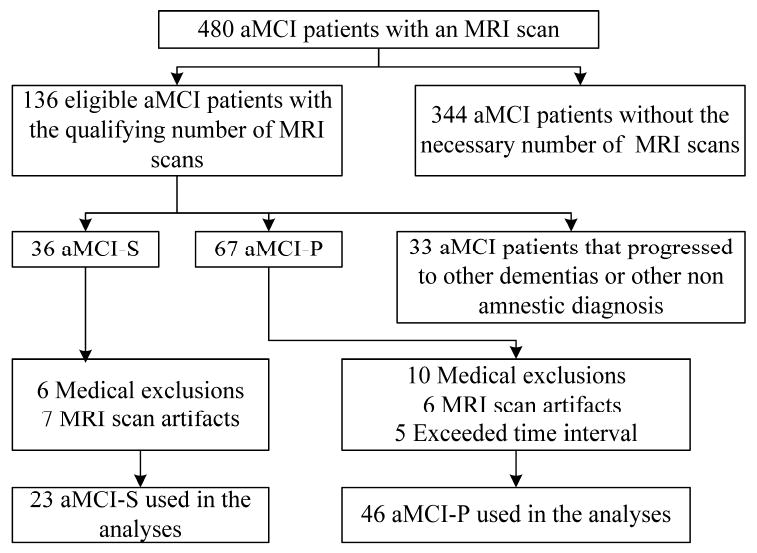
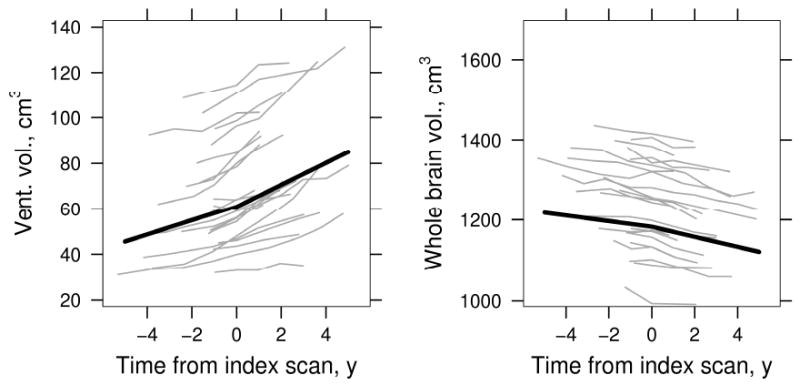
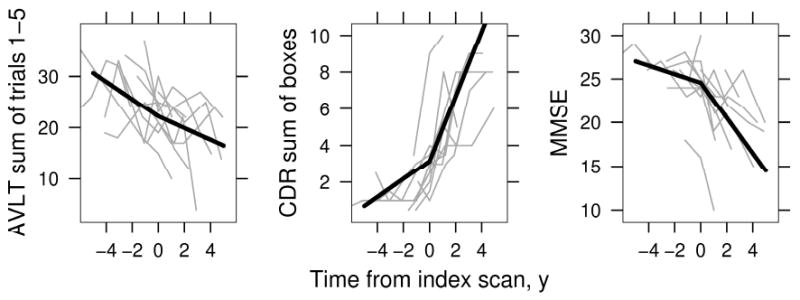
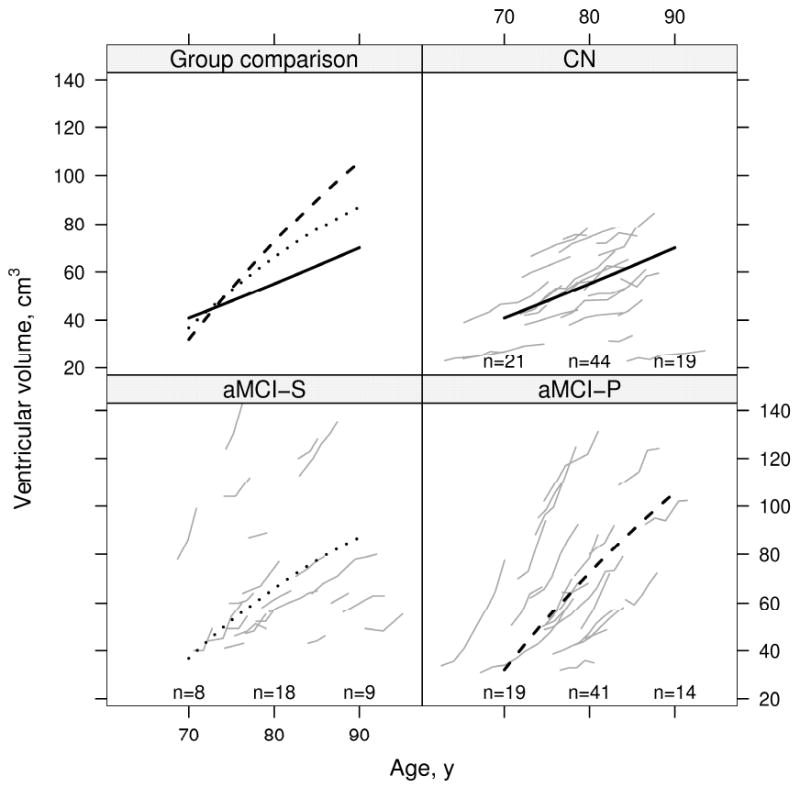
Methods: We studied 46 subjects with aMCI who progressed to AD (labeled aMCI-P), 46 CN, and 23 aMCI-S. All subjects must have had three or more serial MRI scans. Rates of brain shrinkage and ventricular expansion were measured across all available serial MRI scans in each subject. Change in volumes relative to the point at which subjects progressed to a clinical diagnosis of AD (the index date) was modeled in aMCI-P. Change in volumes relative to age was modeled in all three clinical groups.

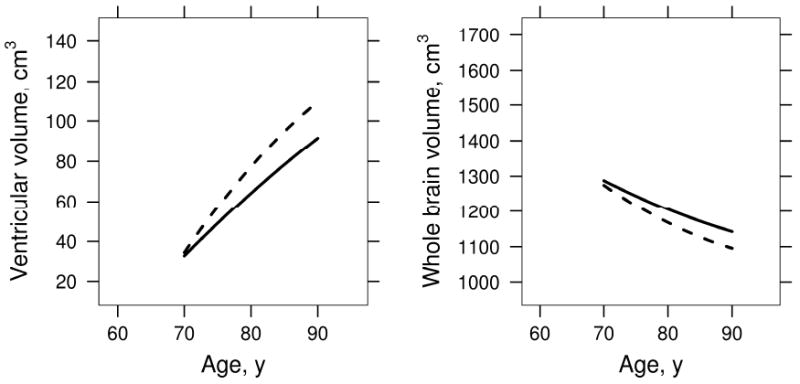
Results: In aMCI-P the change in pre to post index rate (i.e., acceleration) of ventricular expansion was 1.7 cm(3)/year, and acceleration in brain shrinkage was 5.3 cm(3)/year. Brain volume declined and ventricular volume increased in all three groups with age. Volume changes decelerated with increasing age in aMCI-P, and to a lesser extent in aMCI-S, but were linear in the matched CN. Among all subjects with aMCI, rates of atrophy were greater in apolipoprotein E epsilon 4 carriers than noncarriers.

Conclusions: Rates of atrophy accelerate as individuals progress from amnestic mild cognitive impairment (aMCI) to typical late onset Alzheimer disease (AD). Rates of atrophy are greater in younger than older subjects with aMCI who progressed to AD and subjects with aMCI who did not progress. We did not find that atrophy rates varied with age in 70- to 90-year-old cognitively normal subjects.


Figures

Figure 1
Figure 1
Flow diagram for the aMCI stable and aMCI progressor patients
Figure 2
Figure 2
aMCI - progressors: ventricular and whole brain atrophy before and after AD diagnosis (index) scan. Thin gray lines represent a random sample of 23 individual subject volumes over time, thick black line indicates average volume. Average volumes are shown assuming a woman with a total intracranial volume of 1.4 L whose index scan is at age 79.
Figure 3
Figure 3
aMCI - Progressors. AVLT sum of words learned over trials 1 through 5, CDR sum of boxes, and MMSE before and after index date. Thin gray lines represent a random sample of 10 individual subject values over time, thick black line indicates estimated average values. Average values are shown assuming a woman with 12 years of education whose index scan is at age 79.
Figure 4
Figure 4
Change in ventricular volume with age by group. Thin gray lines represent individual subject volumes over time. The solid black line represents estimated average volume for CN, the dotted black line represents estimated average volume for aMCI-S, and the dashed black line represents estimated average volume for aMCI-P. Average volumes are shown assuming a woman with a total intracranial volume of 1.4 L. To better see individual trajectories, random subsets of 23 subjects in the CN and aMCI-P are shown. The number of subjects included in the analysis within 5 years of 70 years, 80 years, and 90 years are indicated within the panel.
Figure 5
Figure 5
Change in brain volume with age by group. Thin gray lines represent individual subject volumes over time. The solid black line represents estimated average volume for CN, the dotted black line represents estimated average volume for aMCI-S, and the dashed black line represents estimated average volume for aMCI-P. Average volumes are calculated assuming a woman with a total intracranial volume of 1.4 L. To better see individual trajectories, random subsets of 23 subjects in the CN and aMCI-P are shown. The number of subjects included in the analysis within 5 years of 70 years, 80 years, and 90 years are indicated within the panel.
Figure 6
Figure 6
Change in AVLT sum of words learned on trials 1 to 5 with age by group. Thin gray lines represent individual subject scores over time. The solid black line represents the estimated average for CN, the dotted black line represents the estimated average for aMCI-S, and the dashed black line represents the estimated average for aMCI-P. Average scores are calculated assuming a woman with 12 years of education whose index scan is at age 79. To better see individual trajectories, random subsets of 10 subjects in each group are shown. The number of subjects included in the analysis within 5 years of 70 years, 80 years, and 90 years are indicated within the panel.
Figure 7
Figure 7
Change in CDR sum of boxes with age by group. Thin gray lines represent individual subject scores over time. The solid black line represents the estimated average for CN (zero by definition), the dotted black line represents the estimated average for aMCI-S, and the dashed black line represents the estimated average for aMCI-P. Average scores are calculated assuming a woman with 12 years of education whose index scan is at age 79. To better see individual trajectories, random subsets of 10 subjects in each group are shown. The number of subjects included in the analysis within 5 years of 70 years, 80 years, and 90 years are indicated within the panel.
Figure 8
Figure 8
Change in MMSE with age by group. Thin gray lines represent individual subject scores over time. The solid black line represents the estimated average for CN, the dotted black line represents the estimated average for aMCI-S, and the dashed black line represents the estimated average for aMCI-P. Average scores are calculated assuming a woman with 12 years of education whose index scan is at age 79. To better see individual trajectories, random subsets of 10 subjects in each group are shown. The number of subjects included in the analysis within 5 years of 70 years, 80 years, and 90 years are indicated within the panel.
Figure 9
Figure 9
Effect of APOE ε4 on rates in aMCI subjects. Estimated volume by age for APOE ε4 non-carriers (solid line) vs. carriers (dashed line) among aMCI-S and aMCI-P subjects combined.

Comment in

References

    1. Braak H, Braak E, Bohl J. Staging of Alzheimer-related cortical destruction. Eur Neurol. 1993;33:403–408. - PubMed
    1. Hyman B. The neuropathological diagnosis of Alzheimer's disease: clinical-pathological studies. Neurobiology of Aging. 1997;18(4 Suppl):S27–32. - PubMed
    1. Terry RD, Masliah E, Salmon DP, et al. Physical basis of cognitive alterations in Alzheimer's disease: synapse loss is the major correlate of cognitive impairment. Ann Neurol. 1991;30:572–580. - PubMed
    1. Fox NC, Warrington EK, Freeborough PA, et al. Presymptomatic hippocampal atrophy in Alzheimer's disease. A longitudinal MRI study. Brain. 1996;119:2001–2007. - PubMed
    1. Fox NC, Scahill RI, Crum WR, Rossor MN. Correlation between rates of brain atrophy and cognitive decline in AD. Neurology. 1999;52:1687–1689. - PubMed

Publication types

MeSH terms