

Estimating 'net' HIV-related mortality and the importance of background mortality rates
- PMID: 18032941
- PMCID: PMC5786261
- DOI: 10.1097/01.aids.0000299412.82893.62
Estimating 'net' HIV-related mortality and the importance of background mortality rates
Abstract
Objectives: To estimate mortality directly attributable to HIV in HIV-infected adults in low and middle income countries and discuss appropriate methodology.
Design: : Illustrative analysis of pooled data from six studies across sub-Saharan Africa and Thailand with data on individuals with known dates of seroconversion to HIV.
Methods: Five of the studies also had data from HIV-negative subjects and one had verbal autopsies. Data for HIV-negative cohorts were weighted by the initial age and sex distribution of the seroconverters. Using the survival of the HIV-negative group to represent the background mortality, net survival from HIV was calculated for the seroconverters using competing risk methods. Mortality from all causes and 'net' mortality were modelled using piecewise exponential regression. Alternative approaches are explored in the dataset without information on mortality of uninfected individuals.
Results: The overall effect of the net mortality adjustment was to increase survivorship proportionately by 2 to 5% at 6 years post-infection. The increase ranged from 2% at ages 15-24 to 22% in those 55 and over. Mortality rate ratios between sites were similar to corresponding ratios for all-cause mortality.
Conclusion: Differences between HIV mortality in different populations and age groups are not explained by differences in background mortality, although this does appear to contribute to the excess at older ages. In the absence of data from uninfected individuals in the same population, model life tables can be used to calculate background rates.
Conflict of interest statement
Conflicts of interest: None.
Figures
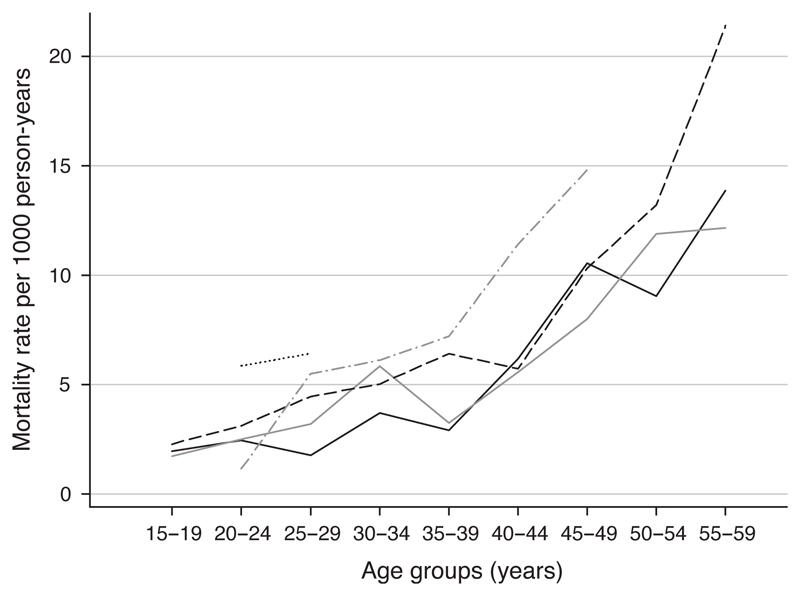
 Kisesa;
  Masaka;
  Rakai;
  South African miners; Thai military.
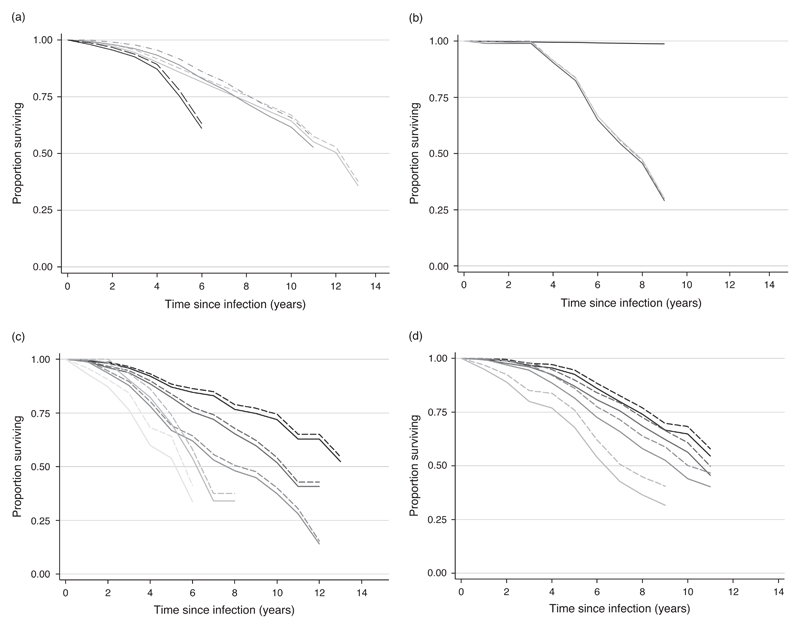
 East Africa population (gross);
  east Africa population (net);
  South Africa miners (gross);
  South Africa miners (net);
  Thai military (gross);
  Thai military (net). (b) Survival curves from time since infection for Thai blood donor and partner cohort using a general population lifetable method and verbal autopsy data to calculate net survival.
  Survival of HIV-negative individuals using weighted U N Population Division ‘without AIDS’ life table;
  gross survival of seroconverters;
  net survival using verbal autopsy data;
  net survival using weighted U N Population Division ‘without AIDS’ life table. (c) Net and gross survival curves by age at infection (seroconversion) for east African studies.
  15–24 years (gross);
  15–24 years (net);
  25–34 years(gross);
  25–34 years(net);
  35–44 years(gross);
  35–44 years(net);
  45–54 years (gross);
  45–54 years (net);
  55+ years (gross);
  55+ years (net). (d) Net and gross survival curves by age at infection (seroconversion) for South African miners.
  15–24 years (gross);
  15–24 years (net);
  25–34 years (gross);
  25–34 years (net);
  35–44 years (gross);
  35–44 years (net);
  45+ years (gross);
  45+ years (net).
References
-
- Collaborative Group on AIDS Incubation and HIV Survival including the CASCADE EU Concerted Action. Time from HIV-1 seroconversion to AIDS and death before widespread use of highly-active antiretroviral therapy: a collaborative re-analysis. Lancet. 2000;355:1131–1137. - PubMed
-
- United Nations. Model life tables for developing countries. New York: United Nations; 1982.
-
- Population Division of Department of Economic and Social Affairs of the United Nations Secretariat. World Population Prospects: The 2002 Revision, Volume 1: Comprehensive tables. New York: United Nations; 2003.
-
- Mulder DW, Nunn AJ, Wagner HU, Kamali A, Kengeya-Kayondo JF. HIV-1 incidence and HIV-1-associated mortality in a rural Ugandan population cohort. AIDS. 1994;8:87–92. - PubMed
Publication types
MeSH terms
Grants and funding
LinkOut - more resources
Full Text Sources
Medical
