. 2008 Jan;7(1):328-38.
doi: 10.1021/pr070300g. Epub 2007 Nov 23.

A quantitative proteomic analysis of mitochondrial participation in p19 cell neuronal differentiation

Affiliations

A quantitative proteomic analysis of mitochondrial participation in p19 cell neuronal differentiation

Jermel Watkins et al. J Proteome Res. 2008 Jan.

Abstract

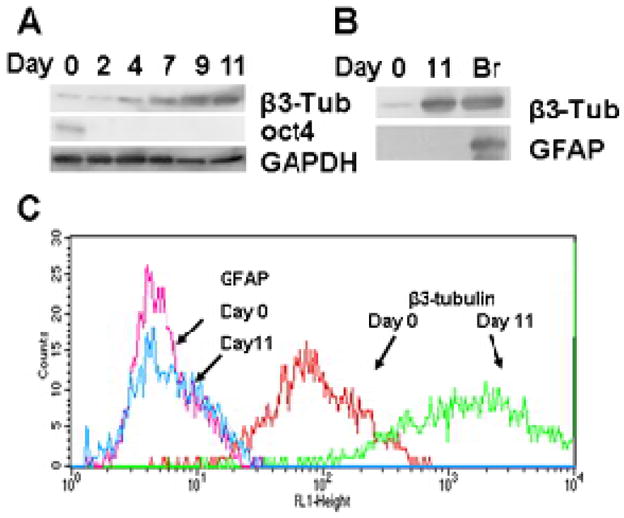
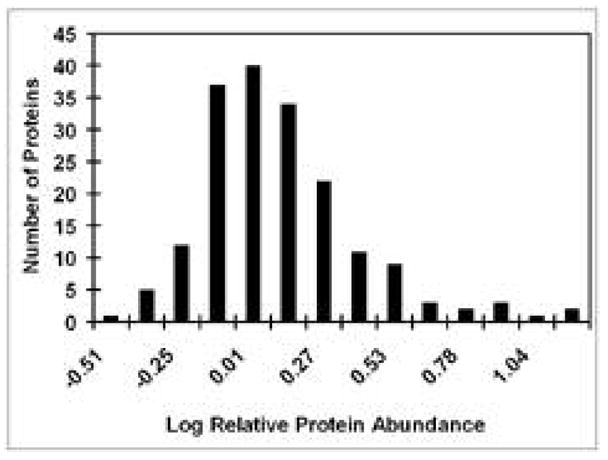
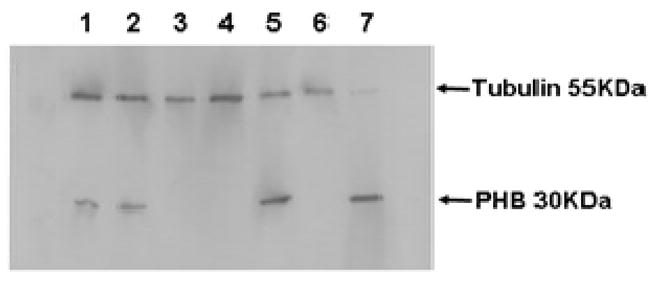
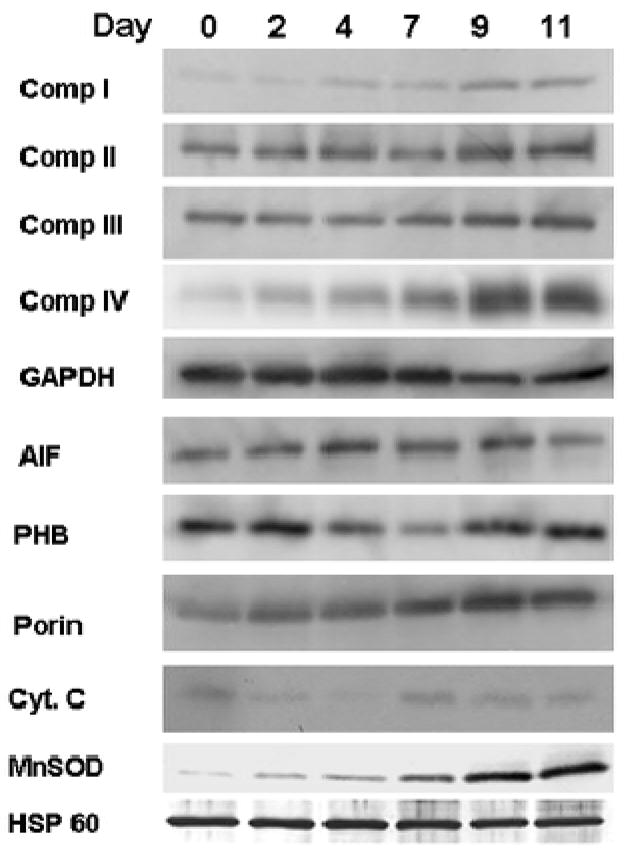
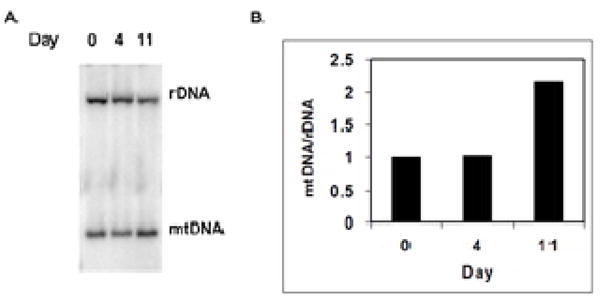
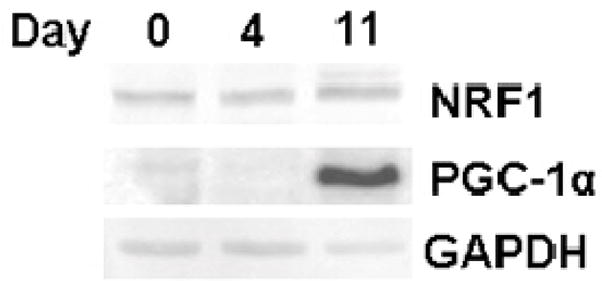
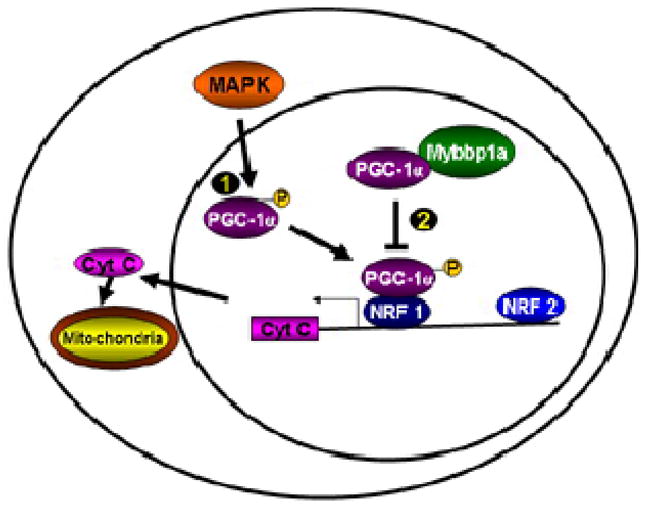
A quantitative proteomic analysis of changes in protein expression accompanying the differentiation of P19 mouse embryonal carcinoma cells into neuron-like cells using isobaric tag technology coupled with LC-MS/MS revealed protein changes reflecting withdrawal from the cell cycle accompanied by a dynamic reorganization of the cytoskeleton and an up-regulation of mitochondrial biogenesis. Further study of quantitative changes in abundance of individual proteins in a purified mitochondrial fraction showed that most mitochondrial proteins increased significantly in abundance. A set of chaperone proteins did not participate in this increase, suggesting that neuron-like cells are relatively deficient in mitochondrial chaperones. We developed a procedure to account for differences in recovery of mitochondrial proteins during purification of organelles from distinct cell or tissue sources. Proteomic data supported by RT-PCR analysis suggests that enhanced mitochondrial biogenesis during neuronal differentiation may reflect a large increase in expression of PGC-1alpha combined with down-regulation of its negative regulator, p160 Mybbp1a.


Figures

Figure 1
Figure 1
Differentiation of P19 embryonal carcinoma cells to neuron-like cells. A. In vitro differentiated P19 cells express markers of mature neurons. 3 μg samples of total protein from days 0, 2, 4, 7, 9 and 11 of the developmental program were fractionated by SDS-PAGE, transferred to a PVDF membrane and probed with various antisera: β3-tubulin, marker for mature neurons; Oct4, a marker for pluripotent stem cells; GAPDH, a loading control. B. 3 μg samples of total P19 cell protein from days 0 or 11 or from a mouse brain homogenate (Br) were fractionated by SDS-PAGE and probed by immunoblotting with antibodies directed against β3 tubulin and GFAP (glial fibrillary acidic protein). C. Undifferentiated P19 cells (day 0) and day 11 NLCs were subjected to flow cytometry to analyze the distribution of cells responding to a glial marker GFAP, and a neuronal marker β3-tubulin as indicated.
Figure 2
Figure 2
Changes in abundance of total cell proteins during neuronal differentiation. The distribution of the number of proteins with log iTRAQ® ratios in the indicated ranges is shown.
Figure 3
Figure 3
Purity of the mitochondrial preparation. 3 μg of protein from each fraction during purification was subjected to electrophoresis. Proteins were transferred to PVDF membrane and probing with antibodies directed against tubulin as a cytoskeletal marker and prohibitin as a mitochondrial marker. Lanes contained the following fractions: 1. Total homogenate; 2. Post-nuclear supernatant; 3. Nuclear pellet; 4. Post-mitochondrial supernatant; 5. Crude mitochondrial pellet; 6. Microsomal fraction; and 7. Purified mitochondria.
Figure 4
Figure 4
Quantitative changes in abundance of mitochondrial proteins during differentiation. The changes in abundance during neuronal differentiation are shown for several classes of mitochondrial proteins. Panel A includes proteins belonging to respiratory complexes I, III and IV. Panel B shows subunits of F1, F0 ATPase (Complex V). Panel C shows changes in abundance of proteins in the TCA cycle. Panels D and E depict data for membrane transporters and chaperones, respectively. Note the differences in scale between different panels.
Figure 5
Figure 5
Immunoblots validate changes in expression of mitochondrial proteins during differentiation. 3 μg samples of total cell proteins from cultures at different stages in the induction program from day 0 through 11 were subjected to SDS-PAGE, blotted and probed for a variety of mitochondrial proteins. Antibodies used were specific for individual polypeptides of the respiratory complexes I–IV, GAPDH (loading control), Porin (VDAC), Cyt. C (cytochrome C), AIF (apoptosis inducing factor), PHB (prohibitin 1), MnSOD (manganese superoxide dismutase), and HSP 60 (heat shock protein 60).
Figure 6
Figure 6
Increase of mtDNA during neuronal differentiation. A. Total cellular DNA was prepared from undifferentiated cells and from cells at days 4 and 11 of the differentiation program. 10 μg samples of DNA were digested with EcoRI, fractionated by agarose gel electrophoresis, transferred to a Hybond N+ membrane and probed with a mixture of 32P-labeled probes to detect both nuclear rDNA and mtDNA. Hybridization of probes to DNA was detected and quantified with a phosphorimager. B. Quantification of mitochondrial DNA to nuclear ribosomal DNA.
Figure 7
Figure 7
Differential expression of protein regulated upon NLC differentiation. Immunoblot analysis of NRF1, PGC-1α and GAPDH at days 0, 4 and 11 of the differentiation time course.
Figure 8
Figure 8
PGC-1α and NRF1 modulate expression of nuclear genes encoding mitochondrial proteins. Neuronal differentiation involves a dramatic up-regulation of expression of PGC-1α. Upon phosphorylation it can actively bind its regulatory partner NRF1 to activate expression of nuclear genes encoding mitochondrial proteins such as cytochrome C (Cyt C). A second regulatory mechanism is illustrated when PGC-1α is bound by Mybbp1a (p160), cannot be phosphorylated and cannot activate NRF1.

References

    1. Bain G, Ray WJ, Yao M, Gottlieb DI. From Embryonal Carcinoma Cells to Neurons: The P19 Pathway. BioEssays. 1994;16:343–348. - PubMed
    1. McBurney MW, Rogers BJ. Isolation of male embryonic carcinoma cells and their chromosome replication patterns. Dev Biol. 1982;89:503–508. - PubMed
    1. Rossant J, McBurney MW. The developmental potential of a euploid male teratocarcinoma cell line after blastocyst injection. J Embryol Exp Morph. 1982;70:99–112. - PubMed
    1. Meeks JP, Mennerick S. Feeding hungry neurons: astrocytes deliver food for thought. Neuron. 2003;37(2):187–9. - PubMed
    1. Voutsinos-Porche B, Bonvento G, Tanaka K, Steiner P, Welker E, Chatton JY, Magistretti PJ, Pellerin L. Glial glutamate transporters mediate a functional metabolic crosstalk between neurons and astrocytes in the mouse developing cortex. Neuron. 2003;37(2):275–86. - PubMed

Publication types

MeSH terms