. 2007 Nov 22:8:428.
doi: 10.1186/1471-2164-8-428.

Genome-wide transcriptional analysis of grapevine berry ripening reveals a set of genes similarly modulated during three seasons and the occurrence of an oxidative burst at vèraison

Affiliations

Genome-wide transcriptional analysis of grapevine berry ripening reveals a set of genes similarly modulated during three seasons and the occurrence of an oxidative burst at vèraison

Stefania Pilati et al. BMC Genomics. .

Abstract

Background: Grapevine (Vitis species) is among the most important fruit crops in terms of cultivated area and economic impact. Despite this relevance, little is known about the transcriptional changes and the regulatory circuits underlying the biochemical and physical changes occurring during berry development.

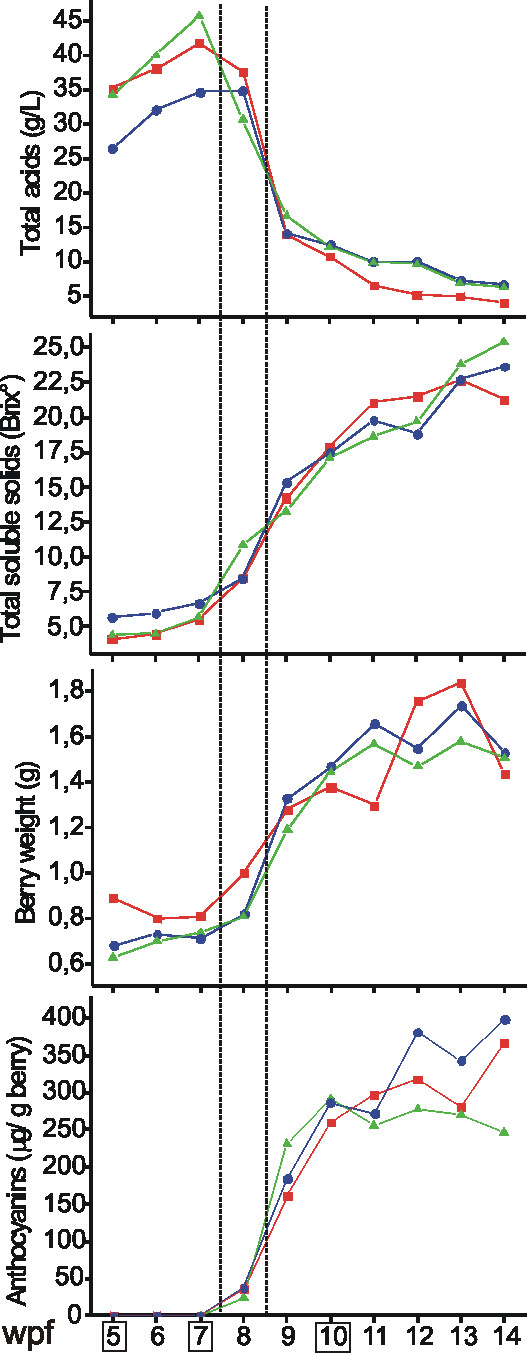
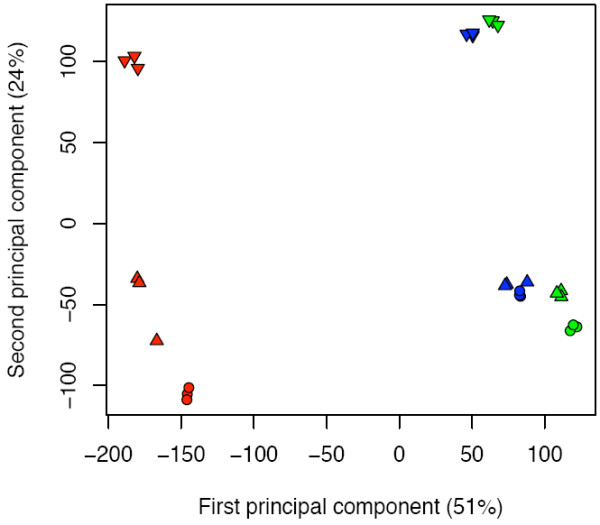
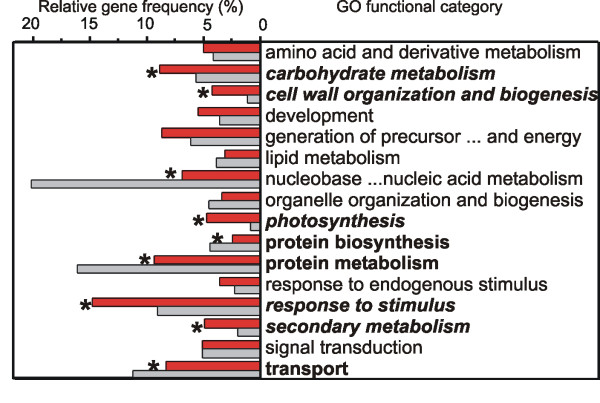
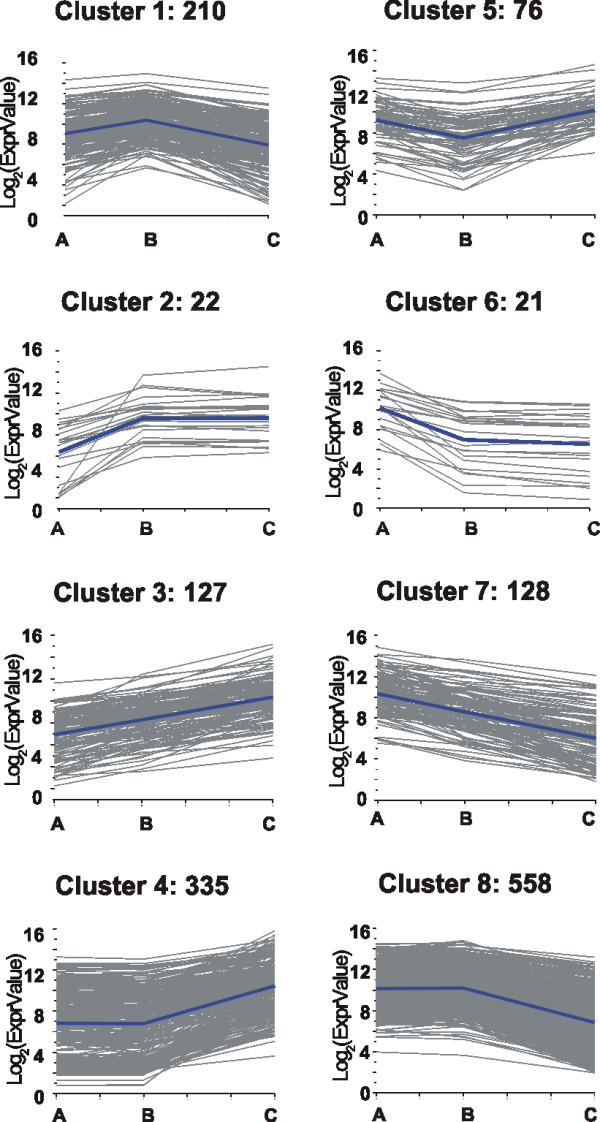
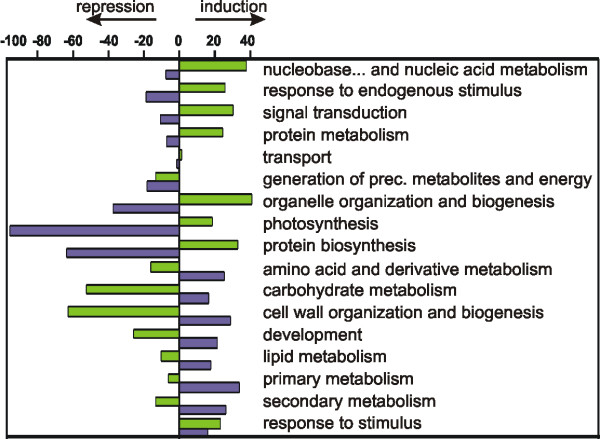
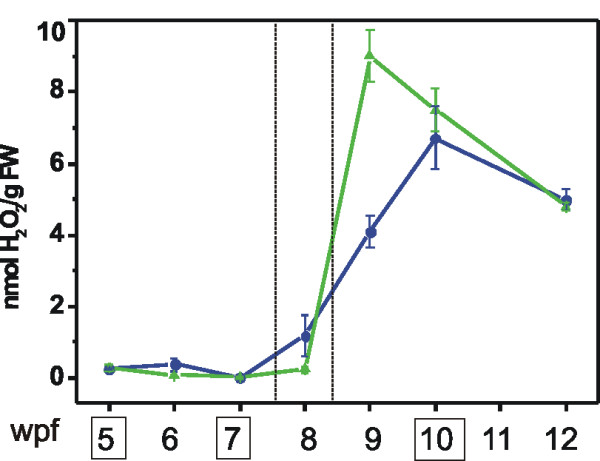
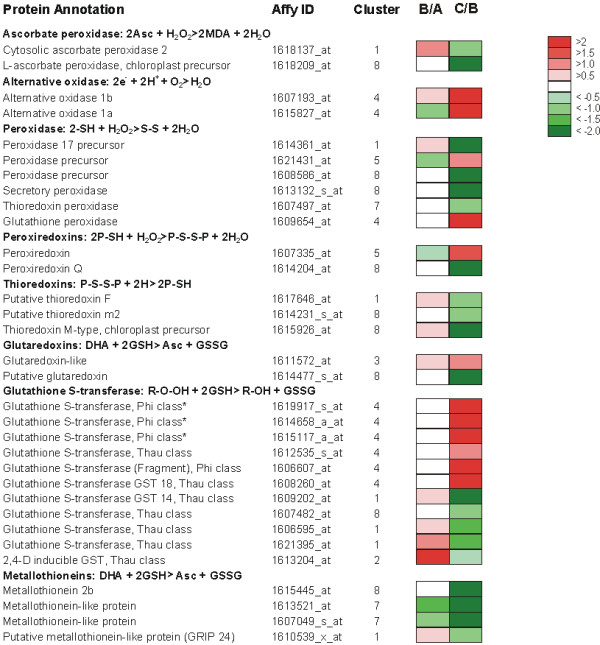
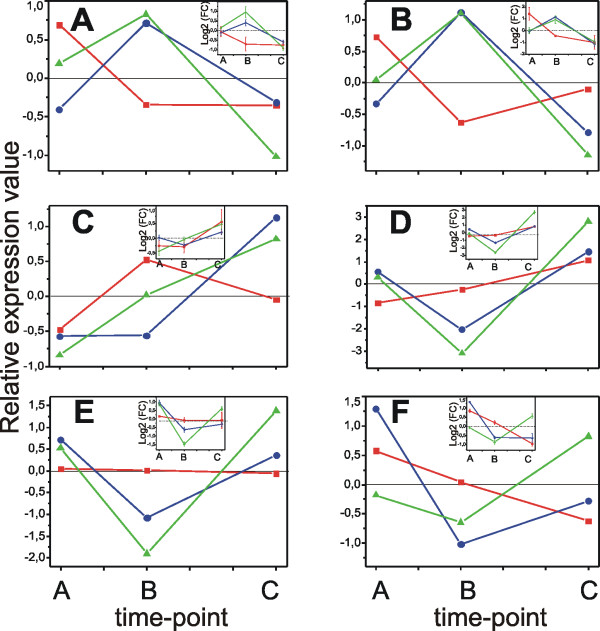
Results: Fruit ripening in the non-climacteric crop species Vitis vinifera L. has been investigated at the transcriptional level by the use of the Affymetrix Vitis GeneChip which contains approximately 14,500 unigenes. Gene expression data obtained from berries sampled before and after véraison in three growing years, were analyzed to identify genes specifically involved in fruit ripening and to investigate seasonal influences on the process. From these analyses a core set of 1477 genes was found which was similarly modulated in all seasons. We were able to separate ripening specific isoforms within gene families and to identify ripening related genes which appeared strongly regulated also by the seasonal weather conditions. Transcripts annotation by Gene Ontology vocabulary revealed five overrepresented functional categories of which cell wall organization and biogenesis, carbohydrate and secondary metabolisms and stress response were specifically induced during the ripening phase, while photosynthesis was strongly repressed. About 19% of the core gene set was characterized by genes involved in regulatory processes, such as transcription factors and transcripts related to hormonal metabolism and signal transduction. Auxin, ethylene and light emerged as the main stimuli influencing berry development. In addition, an oxidative burst, previously not detected in grapevine, characterized by rapid accumulation of H2O2 starting from véraison and by the modulation of many ROS scavenging enzymes, was observed.

Conclusion: The time-course gene expression analysis of grapevine berry development has identified the occurrence of two well distinct phases along the process. The pre-véraison phase represents a reprogramming stage of the cellular metabolism, characterized by the expression of numerous genes involved in hormonal signalling and transcriptional regulation. The post-véraison phase is characterized by the onset of a ripening-specialized metabolism responsible for the phenotypic traits of the ripe berry. Between the two phases, at véraison, an oxidative burst and the concurrent modulation of the anti-oxidative enzymatic network was observed. The large number of regulatory genes we have identified represents a powerful new resource for dissecting the mechanisms of fruit ripening control in non-climacteric plants.


Figures

Figure 1
Figure 1
Biochemical changes observed during Pinot Noir berry development in 2003 (red), 2005 (blue) and 2006 (green). Total acids (expressed as grams of tartaric acid per liter of must), total soluble solids, and anthocyanins content and berry weight averaged on a pool of 50 berries are reported. The dashed area indicates véraison. The weeks post flowering (wpf) corresponding to the samples used for the hybridization experiments are enclosed in boxes.
Figure 2
Figure 2
Principal component analysis (PCA) of the 27 expression datasets. Scaled expression data relative to 2003 (red), 2005 (blue) and 2006 (green) samples are sharply separated according to the sampling year (first principal component) and to the developmental stage (second principal component). Biological replicates relative to time point A, B and C are represented as circles, triangles and downwards triangles, respectively.
Figure 3
Figure 3
Functional categories distribution in the core set of the modulated genes (red) and in the entire Vitis GeneChip® (grey). Frequencies are calculated as percentage of the whole number of 'GO biological process' terms (1,825 and 21,890 in the modulated and chip sets, respectively). Nine classes, marked by an asterisk and written in bold, resulted differently represented in the modulated set compared to the entire chip after statistical analysis (p-value < 0.001). In italics are the five categories overrepresented in the modulated set.
Figure 4
Figure 4
Cluster analysis of the expression profiles of the modulated core set. The expression profiles of the 1477 modulated genes during P. Noir berry ripening were clusterised in eight clusters which represent the minimum number of profiles considering three time points. Clusters were obtained by the k-means method using Pearson's correlation distance. The representative profile and the number of genes in each cluster are indicated.
Figure 5
Figure 5
Functional categories distribution before and after-véraison. Induced and repressed functional categories during the first stage (from TP A to TP B, green histograms) derive from clusters 1, 2, 3 and 5, 6, 7, respectively, while categories induced and repressed during the second stage (from TP B to TP C, violet histograms) derive from clusters 3, 4, 5 and 1, 7, 8, respectively. The relative number of induced (Ni) or repressed (Nr) genes for a specific functional category was calculated with respect to the total number of induced or repressed genes in each stage. The estimate of induction or repression within each functional category was then calculated as follows: estimate of induction/repression = (Ni - Nr)/(Ni + Nr). Positive values represent an overall induction and negative values an overall repression.
Figure 6
Figure 6
H2O2 content during berry ripening in 2005 (blue) and 2006 (green) samples. Data are means ± SE of three replicates. The weeks post flowering (wpf) corresponding to the samples used for the hybridization experiments are enclosed in boxes. Véraison time is delimited within dotted lines.
Figure 7
Figure 7
Genes involved in the response to oxidative stress modulated during ripening. List of the ROS-scavenging genes found in the modulated core set and comparative analysis of their expression in the three sampling TPs. Log2 ratios of the expression values observed in TPs A, B and C (B/A and C/B) are visualized by a colour scale, where red indicates an increase and green a decrease. For each functional group the corresponding enzymatic reaction is reported. * refer to probesets probably corresponding to the same transcript.
Figure 8
Figure 8
Real time RT-PCR validation of the expression profiles of six genes highly influenced by the season. A: 1615199_at, Cryptochrome 1; B: 1616872_at, Pseudo response regulator 9; C: 1614764_at, VvHT2, hexose transporter 2; D: 1606663_at, VvChs3, chalcone synthase isoform 3; E: 1607732_at, VvChs2: chalcone synthase isoform 2; F: 1620424_at, VvChi2, chalcone isomerase isofom 2. 2003 profiles are represented in red, 2005 in blue and 2006 in green. Relative expression data of the array hybridization experiments were centered on the average of the log2 values of each season. Expression profiles measured by RT-PCR experiments (insets) were first centered on the mean Ct value calculated on the three seasons for each gene and then log2 transformed. RT-PCR data are reported as means ± SE of three technical replicates.

References

    1. Doligez A, Adam-Blondon AF, Cipriani G, Di Gaspero G, Laucou V, Merdinoglu D, Meredith CP, Riaz S, Roux C, This P. An integrated SSR map of grapevine based on five mapping populations. Theor Appl Genet. 2006;113:369–382. doi: 10.1007/s00122-006-0295-1. - DOI - PubMed
    1. IASMA Genomics http://genomics.research.iasma.it
    1. NCBI dbest http://www.ncbi.nlm.nih.gov/dbEST/
    1. Coombe BG, Mccarthy MG. Dynamics of Grape Berry Growth and Physiology of Ripening. Aust J Grape Wine Res. 2000;6:131–135.
    1. Ablett E, Seaton G, Scott K, Shelton D, Graham MW, Baverstock P, Lee LS, Henry R. Analysis of grape ESTs: global gene expression patterns in leaf and berry. Plant Sci. 2000;159:87–95. doi: 10.1016/S0168-9452(00)00335-6. - DOI - PubMed

Publication types

MeSH terms