. 2007 Nov 22:8:429.
doi: 10.1186/1471-2164-8-429.

Transcriptomic and metabolite analyses of Cabernet Sauvignon grape berry development

Affiliations

Transcriptomic and metabolite analyses of Cabernet Sauvignon grape berry development

Laurent G Deluc et al. BMC Genomics. .

Abstract

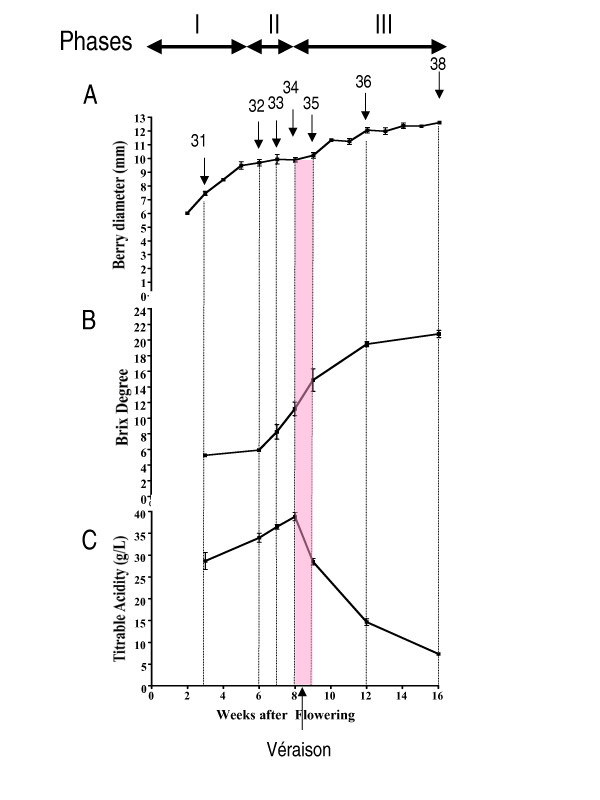
Background: Grape berry development is a dynamic process that involves a complex series of molecular genetic and biochemical changes divided into three major phases. During initial berry growth (Phase I), berry size increases along a sigmoidal growth curve due to cell division and subsequent cell expansion, and organic acids (mainly malate and tartrate), tannins, and hydroxycinnamates accumulate to peak levels. The second major phase (Phase II) is defined as a lag phase in which cell expansion ceases and sugars begin to accumulate. Véraison (the onset of ripening) marks the beginning of the third major phase (Phase III) in which berries undergo a second period of sigmoidal growth due to additional mesocarp cell expansion, accumulation of anthocyanin pigments for berry color, accumulation of volatile compounds for aroma, softening, peak accumulation of sugars (mainly glucose and fructose), and a decline in organic acid accumulation. In order to understand the transcriptional network responsible for controlling berry development, mRNA expression profiling was conducted on berries of V. vinifera Cabernet Sauvignon using the Affymetrix GeneChip Vitis oligonucleotide microarray ver. 1.0 spanning seven stages of berry development from small pea size berries (E-L stages 31 to 33 as defined by the modified E-L system), through véraison (E-L stages 34 and 35), to mature berries (E-L stages 36 and 38). Selected metabolites were profiled in parallel with mRNA expression profiling to understand the effect of transcriptional regulatory processes on specific metabolite production that ultimately influence the organoleptic properties of wine.

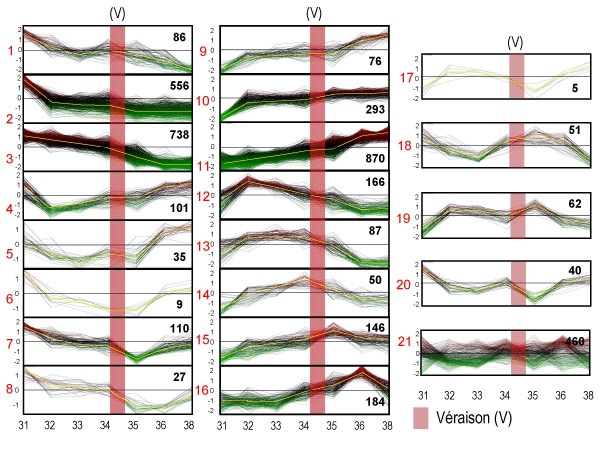
Results: Over the course of berry development whole fruit tissues were found to express an average of 74.5% of probes represented on the Vitis microarray, which has 14,470 Unigenes. Approximately 60% of the expressed transcripts were differentially expressed between at least two out of the seven stages of berry development (28% of transcripts, 4,151 Unigenes, had pronounced (> or =2 fold) differences in mRNA expression) illustrating the dynamic nature of the developmental process. The subset of 4,151 Unigenes was split into twenty well-correlated expression profiles. Expression profile patterns included those with declining or increasing mRNA expression over the course of berry development as well as transient peak or trough patterns across various developmental stages as defined by the modified E-L system. These detailed surveys revealed the expression patterns for genes that play key functional roles in phytohormone biosynthesis and response, calcium sequestration, transport and signaling, cell wall metabolism mediating expansion, ripening, and softening, flavonoid metabolism and transport, organic and amino acid metabolism, hexose sugar and triose phosphate metabolism and transport, starch metabolism, photosynthesis, circadian cycles and pathogen resistance. In particular, mRNA expression patterns of transcription factors, abscisic acid (ABA) biosynthesis, and calcium signaling genes identified candidate factors likely to participate in the progression of key developmental events such as véraison and potential candidate genes associated with such processes as auxin partitioning within berry cells, aroma compound production, and pathway regulation and sequestration of flavonoid compounds. Finally, analysis of sugar metabolism gene expression patterns indicated the existence of an alternative pathway for glucose and triose phosphate production that is invoked from véraison to mature berries.

Conclusion: These results reveal the first high-resolution picture of the transcriptome dynamics that occur during seven stages of grape berry development. This work also establishes an extensive catalog of gene expression patterns for future investigations aimed at the dissection of the transcriptional regulatory hierarchies that govern berry development in a widely grown cultivar of wine grape. More importantly, this analysis identified a set of previously unknown genes potentially involved in critical steps associated with fruit development that can now be subjected to functional testing.


Figures

Figure 1
Figure 1
Physiological data at different stages of berry development. Changes in physiological parameters measured during the major phases (I to III) of berry development and ripening of Cabernet Sauvignon grape berries. A, Berry Diameter (n = 6); B, Brix degree (°) or total soluble solids in the berry juice (n = 6); C, Titratable Acidity (g/L) (n = 6). The stage at which véraison occurs is indicated in pink. Numbers with arrows point to the individual developmental stages defined by the E-L system Coombe [14] used for transcriptome profiling.
Figure 2
Figure 2
Twenty-one profiles of steady-state transcripts exhibiting a two-fold or greater expression across berry development. Profiles are plotted as RMA data values plotted on the log2 scale centered by the mean of all values (Stage 31 to stage 38). E-L Stages are indicated along the X-axis. Profiles numbers are indicated with red numbers with the number of transcripts within each profile indicated with black numbers: Véraison (V) is indicated with a pink stripe. The gradient red to green coloration of individual gene plots indicates values above or below the mean of the cluster, respectively. The cluster template profile is designated by a yellow line.
Figure 3
Figure 3
Functional analyses of steady-state transcripts with a two-fold or greater change in abundance over the course of berry development. A) Percentage of annotated unigenes with a two-fold or greater change in transcript abundance. B) Distribution of Unigenes according to their MIPS functional categories (MIPS 2.0) within the three main phases of berry development. Phase I (E-L stage 31), herbaceous phase; Phase II (E-L stages 32 to 34), lag phase; Phase III (E-L stages 35 to 38), ripening phase. Statistically significant differences between Phase I against II are indicated with white squares. Statistically significant differences between Phase II against III are indicated with black squares. Statistically significant differences between Phase I against III are indicated with asterisks. Percentages are based upon the number of Unigenes in each set. Numbers in parentheses following category names indicates the MIPS number for each category.
Figure 4
Figure 4
Transcripts displaying transient expression patterns. Each value plotted is the mean normalized intensity values obtained for the three biological replicates. The three key phases of the berry development (I, II, III) were applied as reference. A) Black solid round (1618814_at, NP864096)-ornithine decarboxylase, red solid triangle (1616399_s_at, CB005833)-arginine decarboxylase, green solid triangle (1611257_a_at, TC51832)-L-asparaginase, blue solid diamond (1618848_at, TC52577)-xyloglucan endotransglycosylase transferase. B) Black solid round (1608074_s_at, TC62965)-α-expansin, red solid triangle (1608191_at, TC64448) α-expansin, green solid triangle (1613161_at, TC69794)-limonene cyclase, blue solid diamond (1618595_at, TC53841)-(-)-isopiperitenol dehydrogenase.
Figure 5
Figure 5
Expression of phytohormone transcripts. A) Black solid round (1608022_at, TC57089)-NCED isoform 1, red solid triangle (1607029_at, TC55541)-NCED isoform 4, green solid triangle (1614892_at, TC54474)-ABI1 protein phosphatase type 2C, blue solid diamond (1619802_at, TC67323)-RD22, orange solid square (1621346_at, TC65114)-ABI3 transcription factor. B) Black solid round (1617012_at, TC68057)-ethylene responsive factor 1, red solid triangle (1619585_at, TC62897)-ethylene induced transcription factor, green solid triangle (1621552_at, TC66829)-ethylene co-activator, blue solid diamond (1615952_s_at, TC56709)-aminocyclopropane carboxylic acid synthase, orange solid square (1622402_at, TC62349)-ERS1 ethylene receptor, lavender open square (1618518_at, TC55908)-EIN4/ETR5 ethylene receptor. *: transcript that does not pass the two-fold ratio. C) Black solid round (1617572_at, TC66046)-BRH1 brassinosteroid-responsive protein, red solid triangle (1612516_at, TC56501)-BRI1 brassinosteroid-responsive protein, green solid triangle (1619068_at, TC60314)-brassinosteroid-responsive protein, blue solid diamond (1608945_at, TC54729)-BRU1 brassinosteroid-responsive protein. *: transcript that does not pass the two-fold ratio. Black solid round (1618181_at, TC67464)-GIDL1 receptor, red solid triangle (1620071_at, TC56624)-GIDL2 Receptor, green solid triangle (1606777_s_at, TC56894)-GA1a gibberellin oxidase, blue solid diamond (1610610_at, TC66284)-gibberellic acid β hydroxylase. *: transcript that does not pass the two-fold ratio. E) Black solid round (1614660_at, TC53887)-auxin responsive protein (Aux22), red solid triangle (1613813_a_at, TC65541)-auxin responsive factor 2, green solid triangle (1609591_at, TC63193)-small auxin up RNA protein, blue solid diamond (1606566_at, TC62299)-SAUR protein, orange solid square (1616225_at, TC52772)-auxin responsive factor 18, lavender open square (1619610_at, TC56575)-IAA-amino acid hydrolase, brown open triangle (1611479_at, CD799903)-auxin transporter, pink open triangle (1617179_at, CF414958)-auxin efflux carrier, purple open diamond (1610034_at, TC59892)-auxin binding protein. F) Black solid round (1607601_at, TC61395)-12-oxophytodienoate reductase, red solid triangle (1614324_at, CF213899)-constitutive pathogen response 5 (CPR5), green solid triangle (1620306_at, TC69712)-cytokinin oxidase, blue solid diamond (1612955_at, TC52530)-Type-A response regulator.
Figure 6
Figure 6
Expression of potential candidates Unigenes. A) Black solid round (1614028_at, TC67285)-cation-transporting ATPase, red solid triangle (1622073_at, CF404214)-calcium-transporting ATPase, green solid triangle (1617237_s_at, TC66680)-Ca2+/H+ exchanger, blue solid diamond (1618587_at, TC64370)-calmodulin-repressor of gene silencing. B) Black solid round (1619917_s_at, TC69505)-glutathione-S-transferase, red solid triangle (1609870_at, TC58286)-glutathione-S-transferase conjugating ATPase, green solid triangle (1607560_at, TC62162)-multi-drug secondary transporter like protein (MATE), blue solid diamond (1611091_s_at, TC54724)-VvMYBPA1, orange solid square (1618504_at, TC61713)-MYC transcription factor. C) Black solid round (1608603_at, TC56956)-phloroglucinol O-methyltransferase, red solid triangle (1613542_at, TC62584) O-methyltransferase, green solid triangle (1620469_at, CF209780)-O-methyltransferase, blue solid diamond (1616348_at, TC52353)-S-adenosyl-L-methionine:benzoic acid/salicylic acid carboxyl methyltransferase orange solid square (1612552_at, TC57170)-S-adenosyl-L-methionine:salicylic acid carboxyl methyltransferase.
Figure 7
Figure 7
Organic acids and amino acids: metabolites and transcripts. A) Black solid round-tartrate, red solid triangle (1622252_at, TC52651)-L-idonate dehydrogenase, green solid triangle (1613165_s_at, TC52651)-L-idonate dehydrogenase, blue solid diamond (1612918_at, TC52651)-L-idonate dehydrogenase. B) Black solid round-malate, red solid triangle (1612546_at, TC68207)-cytosolic MDH, green solid triangle (1609147_at, TC55437)-cytosolic MDH, blue solid diamond (1622059_at, TC69439)-mitochondrial malate dehydrogenase (MDH), orange solid square (1617448_at, TC54982)-mitochondrial MDH, lavender open square (1609345_s_at, TC57092)-malic enzyme. C) Black solid round-proline, red solid triangle (1619565_at, TC52705)-pyrroline-5-carboxylate synthetase, green solid triangle (1617293_s_at, BQ792635)-proline dehydrogenase, blue solid diamond (1610800_at, CK906448)-proline transporter. *: Transcripts that do not pass the two-fold ratio. All compounds amounts were normalized by a ribitol standard (25 mg/L).
Figure 8
Figure 8
Hexose sugars, transporters, and starch: metabolites and transcripts. A) Black solid round-fructose, red solid triangle-glucose, green solid triangle-sucrose. B) Black solid round (1609402_at, TC62599)-sucrose synthase, red solid triangle (1608257_at, TC68135)-sucrose-6-phosphate phosphatase, green solid triangle (1611613_at, TC60693)-invertase (GIN1), blue solid diamond (1612836_at, TC57719)-invertase (GIN2), orange solid square (1620628_at, TC67908)-neutral invertase, lavender open square (1611027_at, TC56057)-acidic invertase, brown open triangle (1616255_at, TC57339)-fructokinase. C) Black solid round (1616083_at, TC51694)-VvHT1 (hexose transporter 1), red solid triangle (1615257_at, TC65400)-VvHT6 (hexose transporter 6), green solid triangle (1615697_at, TC51724)-VvSUC27 (sucrose transporter), blue solid diamond (1608991_at, TC60060)-plastidial glucose transporter, orange solid square (1613408_at, TC66667)-polyol transporter, lavender open square (1619379_at, TC58801)-plastidial triose phosphate transporter, brown open triangle (1622157_at, TC61733)-plastidial triose phosphate transporter. D) Black solid round (1615571_at, TC53551)-starch synthase, red solid triangle (1613601_at, TC67353)-starch synthase, green solid triangle (1617068_at, TC54621)-plastidial alpha-glucan, water dikinase, blue solid diamond (1617941_at, TC62494)-plastidial alpha-glucan, water dikinase, orange solid square (1622120_at, TC54533)-starch phosphorylase, lavender open square (1613188_at, TC70258)-α-amylase, brown open triangle (1617124_at, TC67979)-β-amylase. All compounds amounts were normalized by a ribitol standard (25 mg/L).
Figure 9
Figure 9
Transcriptomic mapping of transcripts related sucrose and starch metabolism along berry development. SPS: sucrose phosphate synthase-(1614674_at, TC60623), SPP: sucrose phosphate phosphorylase – (1608257_at, TC68135) SUSY: sucrose synthase – a) (1616700_at, TC53526) b) (1619223_s_at, TC52910) c) (1609402_at, TC62599) INV: invertase – a) (1620628_at, TC67908) b) (1611027_at, TC56057) c) (1612836_at, TC57719) d) (1611613_at, TC60693) HK: hexokinase-(1611419_at – TC53318) FK: fructokinase – a) (1628006_at, TC63769), b) (1622282_at, TC54393), c) (1621053_at, TC63955), d) (1616255_at, TC57339) SuT: sucrose transporter – a) (1620256_at, AF021808) b) (1622221_at, AF021809) c) (1615697_at, TC51724) d) (1615257_at, TC65400) NPP: nucleotide pyrophosphatase – (1620770_at, TC53085) SDH: sorbitol dehydrogenase – (1608527_at, TC58983) ST: sorbitol transporter – (1610527_at, TC52979) AGPase: ADP-glucose phosphatase – a) (1608393_at, TC64860) b) (1610928_at, TC64860) SBE: starch branching enzyme – (1621790_at, TC65671) SS: starch synthase – a) (1615571_at, TC53551) b) (1613601_at, TC67353) SP: starch phosphorylase – a) (1622120_at, TC54533) b) (1614707_at, TC53692) α AM: α-amylase – (1613188_at, TC70258) β AM: β-amylase – a) (1617124_at, TC67979) b) (1611808_at, CF205006) SEX: water dikinase – (1617941_at, TC62494) TPT: triose phosphate transporter – a) (1608991_at, TC60060) b) (1619379_at, TC58801) c) (1622157_at, TC61733). Each square from left to right corresponds to the expression of the probe sets from stage 31 through stage 38. Nonsignificant: Does not pass the ANOVA filter.
Figure 10
Figure 10
Quantitative real-time RT-PCR of eleven transcripts. Comparison between the gene expression ratios reported by the Affymetrix GeneChip® genome array and by real-time RT-PCR. Data were from 11 probe sets across seven developmental stages. The difference in the number of PCR cycles required to produce the same amount of product is plotted against the log2 expression ratio averaged over the first time point. The linear regression line was constrained to pass through the origin. Grey solid square (1615402_at, TC56083)-ferulate-5-hydroxylase, Apricot solid triangle (1606794_at, TC63891)-osmotin precursor, red solid triangle (1616700_at, TC53526)-sucrose synthase, orange solid diamond (1607760_at, TC51695) flavonoid-3'5'-hydroxylase, light green solid round (1611650_at, TC57228)-WRKY7, dark green open square (1616880_at, TC54034)-cinnamoyl alcohol dehydrogenase, dark blue open triangle (1613896_at, TC62182)-nitrate/chloride transporter), blue open triangle (1615722_s_at, TC51776)-aquaporin PIP1.1, lavender open diamond (1611342_at, TC55943)-serine/threonine kinase, pink open circle (1612132_s_at, TC68311)-protein phosphatase 2C, brown cross (1614931_at, TC61058)-MYB transcription factor.

References

    1. FAOSTAT database (http://faostat.fao.org) Food and Agriculture Organization of the United Nations; 2007.
    1. Wine Institute http://www.wineinstitute.org/
    1. German JB, Walzem RL. The health benefits of wine. Annu Rev Nutr. 2000;20:561–593. doi: 10.1146/annurev.nutr.20.1.561. - DOI - PubMed
    1. Wollin SD, Jones PJ. Alcohol, red wine and cardiovascular disease. J Nutr. 2001;131:1401–1404. - PubMed
    1. Bradamante S, Barenghi L, Villa A. Cardiovascular protective effects of resveratrol. Cardiovasc Drug Rev. 2004;22:169–188. - PubMed

Publication types

MeSH terms

LinkOut - more resources