. 2008 Feb;190(2):200-10.
doi: 10.1016/j.jmr.2007.10.015. Epub 2007 Nov 1.

In vivo lung morphometry with hyperpolarized 3He diffusion MRI: theoretical background

Affiliations

In vivo lung morphometry with hyperpolarized 3He diffusion MRI: theoretical background

A L Sukstanskii et al. J Magn Reson. 2008 Feb.

Abstract

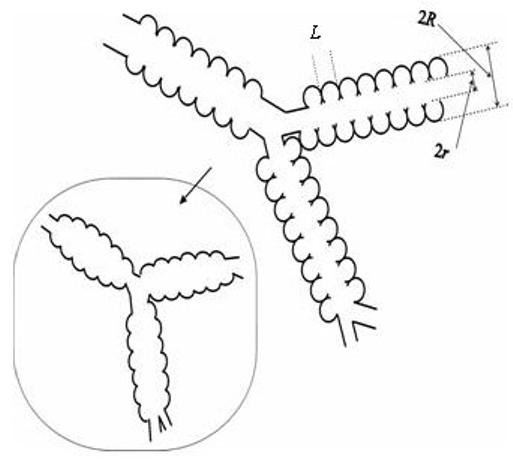
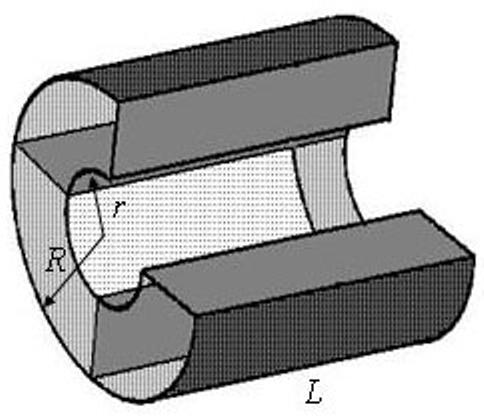
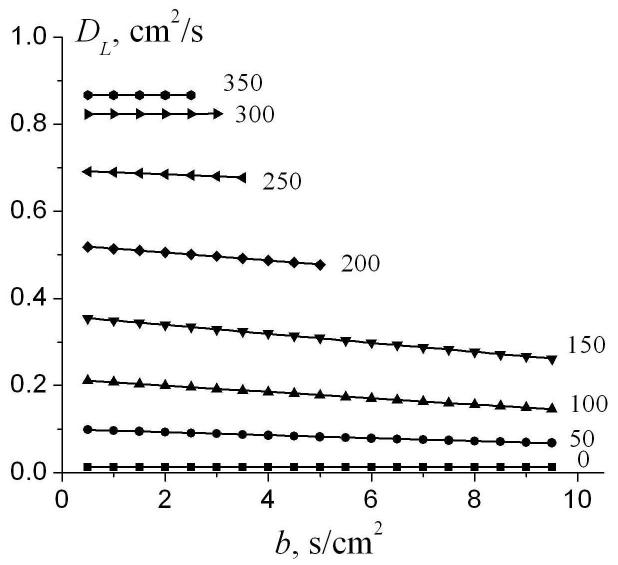
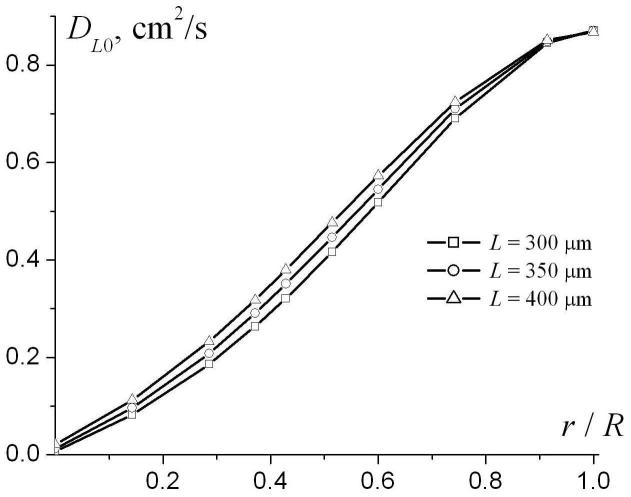
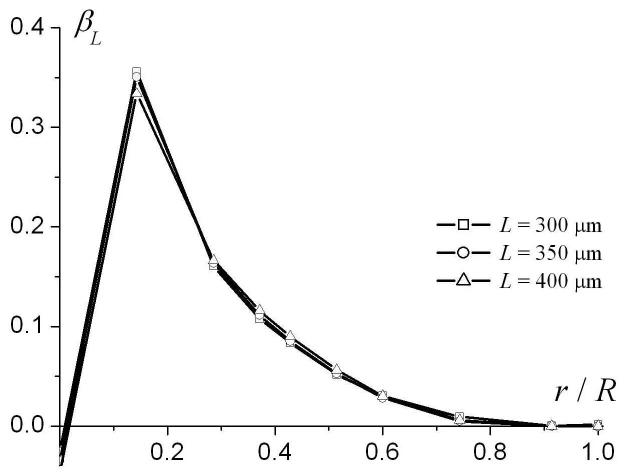
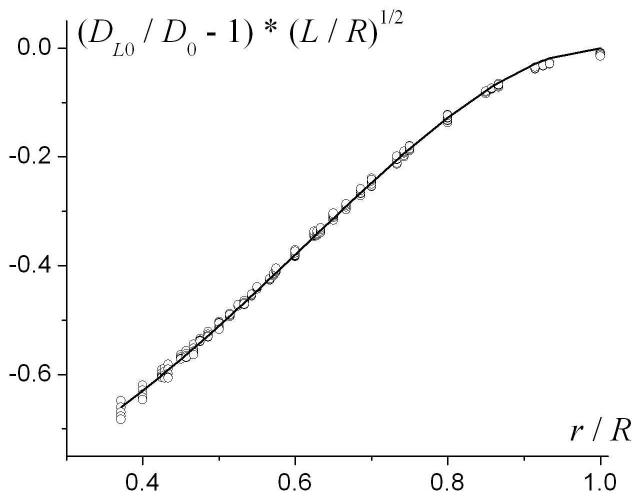
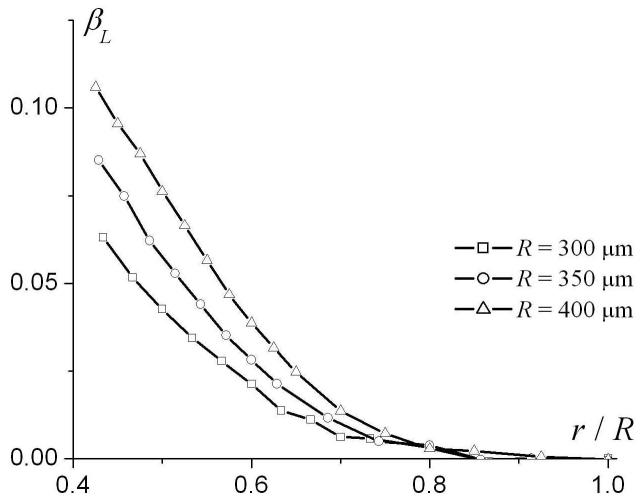
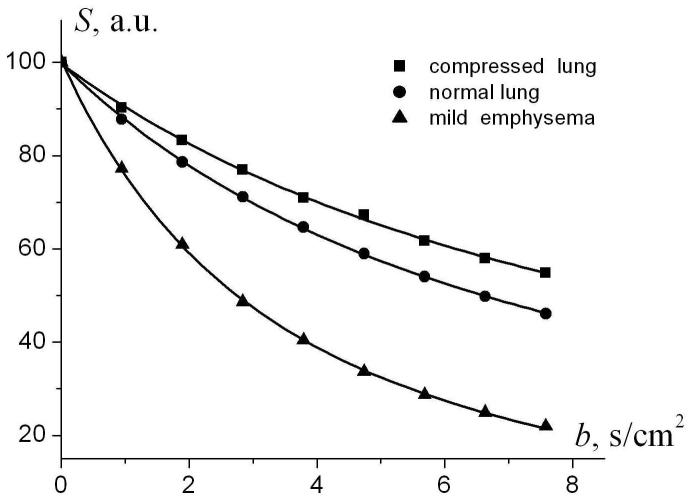
MRI-based study of (3)He gas diffusion in lungs may provide important information on lung microstructure. Lung acinar airways can be described in terms of cylinders covered with alveolar sleeve [Haefeli-Bleuer, Weibel, Anat. Rec. 220 (1988) 401]. For relatively short diffusion times (on the order of a few ms) this geometry allows description of the (3)He diffusion attenuated MR signal in lungs in terms of two diffusion coefficients-longitudinal (D(L)) and transverse (D(T)) with respect to the individual acinar airway axis [Yablonskiy et al., PNAS 99 (2002) 3111]. In this paper, empirical relationships between D(L) and D(T) and the geometrical parameters of airways and alveoli are found by means of computer Monte Carlo simulations. The effects of non-Gaussian signal behavior (dependence of D(L) and D(T) on b-value) are also taken into account. The results obtained are quantitatively valid in the physiologically important range of airway parameters characteristic of healthy lungs and lungs with mild emphysema. In lungs with advanced emphysema, the results provide only "apparent" characteristics but still could potentially be used to evaluate emphysema progression. This creates a basis for in vivo lung morphometry-evaluation of the geometrical parameters of acinar airways from hyperpolarized (3)He diffusion MRI, despite the airways being too small to be resolved by direct imaging. These results also predict a rather substantial dependence of (3)He ADC on the experimentally-controllable diffusion time, Delta. If Delta is decreased from 3 ms to 1 ms, the ADC in normal human lungs may increase by almost 50%. This effect should be taken into account when comparing experimental data obtained with different pulse sequences.


Figures

Fig. 1
Fig. 1
Schematic structure of two levels of acinar airways. Open spheres represent alveoli forming an alveolar sleeve around each airway. Inset schematically represents the structure of the same airways in emphysema, scaled down for clarity.
Fig. 2
Fig. 2
Model of acinar airway covered by alveolar sleeve (alveolar duct) corresponding to the structure depicted in Fig. 1. One segment of the periodic structure is shown; one of four alveoli is removed.
Fig. 3
Fig. 3
Diffusion sensitizing pulse gradient waveform employed in simulations.
Fig. 4
Fig. 4
The longitudinal diffusivity DL as a function of the b-value for different internal radii r (shown by numbers near the lines; in μm). Symbols represent the results of simulations; straight lines - linear fit to Eq. (9). R=L=350μm, Δ = 1.8 ms, τ = 0.3 ms. Data are truncated for bDL > 2, corresponding to the MR signal decay of e-2.
Fig. 5
Fig. 5
The parameters DL0 (a) and βL (b) as functions of r / R for R = 350 μm and different L.
Fig. 5
Fig. 5
The parameters DL0 (a) and βL (b) as functions of r / R for R = 350 μm and different L.
Fig. 6
Fig. 6
The quantity (DL0 / D0 - 1)·(L / R)1/2 as a function of r / R for different R and L (symbols). Solid line - the function f(r / R), Eq. (11).
Fig. 7
Fig. 7
The parameter βL (a) and βL(Ldiff(1)R)2 as functions of r/R for different external radii R. Solid line in (b) - the function g(r) in Eq. (14).
Fig. 7
Fig. 7
The parameter βL (a) and βL(Ldiff(1)R)2 as functions of r/R for different external radii R. Solid line in (b) - the function g(r) in Eq. (14).
Fig. 8
Fig. 8
The transverse diffusivity DT as a function of the b-value for different internal radii r (shown by numbers near the lines; in μm). Symbols represent the results of simulations; straight lines - linear fit to Eq. (16). R=350 μm, parameters of gradient waveform the same as in Fig. 4.
Fig. 9
Fig. 9
The dependence of the parameters DT0 and βT in the linear fit (16) on the ratio r/R for different external radii R.
Fig. 9
Fig. 9
The dependence of the parameters DT0 and βT in the linear fit (16) on the ratio r/R for different external radii R.
Fig. 10
Fig. 10
The dependence of the parameters DT0 and βT on the external radius R (symbols). Solid lines - approximation by Eqs. (18)-(19); dashed line - approximation by Eq. (20). The function βT(RLdiff(2)) is shown only for RLdiff(2)<0.6, where the linear approximation, Eq. (16), is valid.
Fig. 10
Fig. 10
The dependence of the parameters DT0 and βT on the external radius R (symbols). Solid lines - approximation by Eqs. (18)-(19); dashed line - approximation by Eq. (20). The function βT(RLdiff(2)) is shown only for RLdiff(2)<0.6, where the linear approximation, Eq. (16), is valid.
Fig. 11
Fig. 11
In vivo diffusion attenuated MR signal as a function of the b-value for the dog model. Symbols are data from Fig. 4 in [26]. Circles represent an example of the data from a normal lung. Squares and triangles represent an example of the data from a dog with experimentally induced unilateral emphysema. The emphysematous lung demonstrates enlarged airways and a corresponding increase in the signal decay. The contralateral lung appears compressed with smaller than normal airways, demonstrating slower than normal signal decay. Solid lines - fitting of Eqs. (2)-(4) to experimental data. Fitting resulted in the following evaluation of acinar airways geometrical parameters. In the compressed lungs: R = 253 ± 24 μm, r = 65 ± 7 μm, L = 290 ± 32 μm; in the normal lungs: R = 283 ± 10 μm, r = 106 ± 2 μm, L = 310 ± 13 μm; in the lungs with mild emphysema: R = 355 ± 5 μm, r = 278 ± 3 μm, L = 290 ± 49 μm .

References

    1. Yablonskiy DA, Sukstanskii AL, Leawoods JC, Gierada DS, Bretthorst GL, Lefrak SS, Cooper JD, Conradi MS. Quantitative in vivo assessment of lung microstructure at the alveolar level with hyperpolarized 3He diffusion MRI. Proc. National Acad. Sci. 2002;99:3111–3116. - PMC - PubMed
    1. Haefeli-Bleuer B, Weibel ER. Morphometry of the human pulmonary acinus. Anat Rec. 1988;220:401–414. - PubMed
    1. Fichele S, Paley MN, Woodhouse N, Griffiths PD, Van Beek EJ, Wild JM. Finite-difference simulations of 3He diffusion in 3D alveolar ducts: comparison with the “cylinder model”. Magn Reson Med. 2004;52:917–920. - PubMed
    1. Fichele S, Paley MN, Woodhouse N, Griffiths PD, van Beek EJ, Wild JM. Investigating 3He diffusion NMR in the lungs using finite difference simulations and in vivo PGSE experiments. J Magn Reson. 2004;167:1–11. - PubMed
    1. Gao JH, Lemen L, Xiong J, Patyal B, Fox PT. Magnetization and diffusion effects in NMR imaging of hyperpolarized substances. Magn Reson Med. 1997;37:153–158. - PubMed

Publication types

LinkOut - more resources