. 2008 Jan 31;46(2):540-53.
doi: 10.1016/j.neuropsychologia.2007.10.003. Epub 2007 Oct 13.

Data-driven clustering reveals a fundamental subdivision of the human cortex into two global systems

Affiliations

Data-driven clustering reveals a fundamental subdivision of the human cortex into two global systems

Yulia Golland et al. Neuropsychologia. .

Abstract

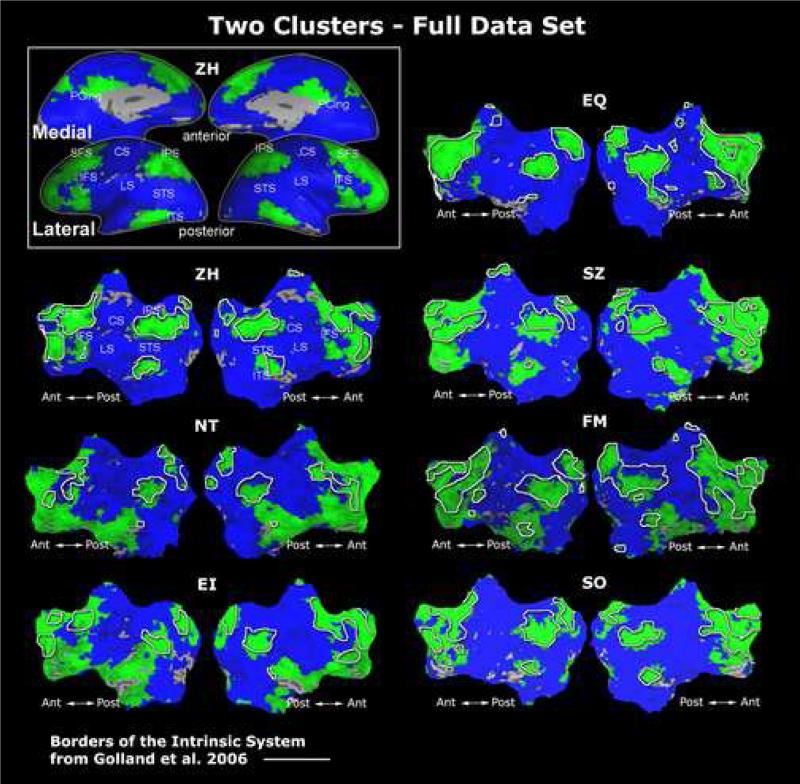
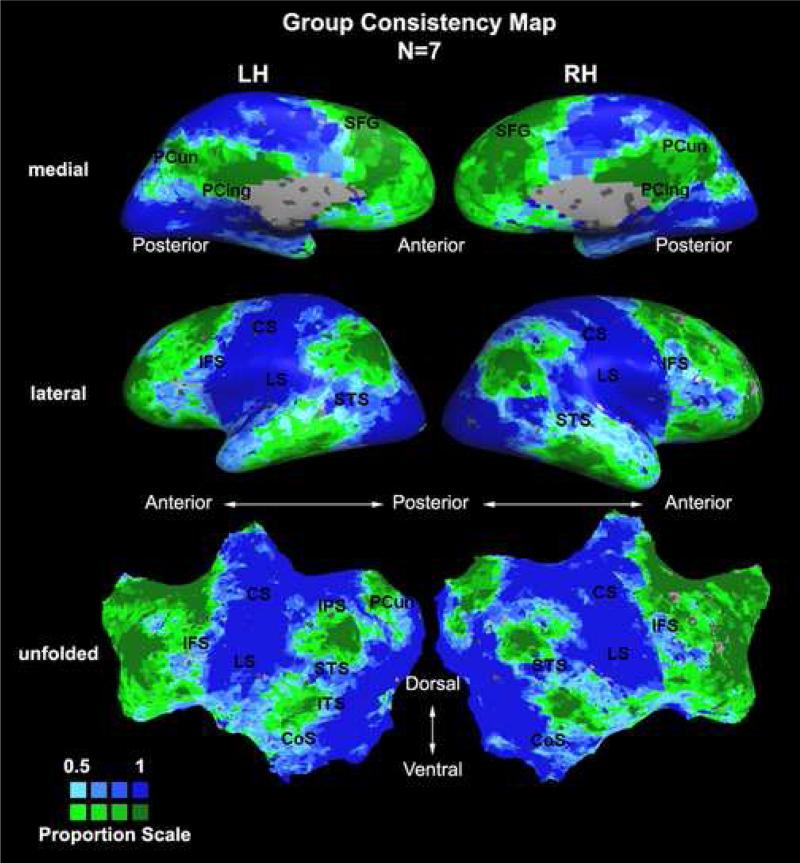
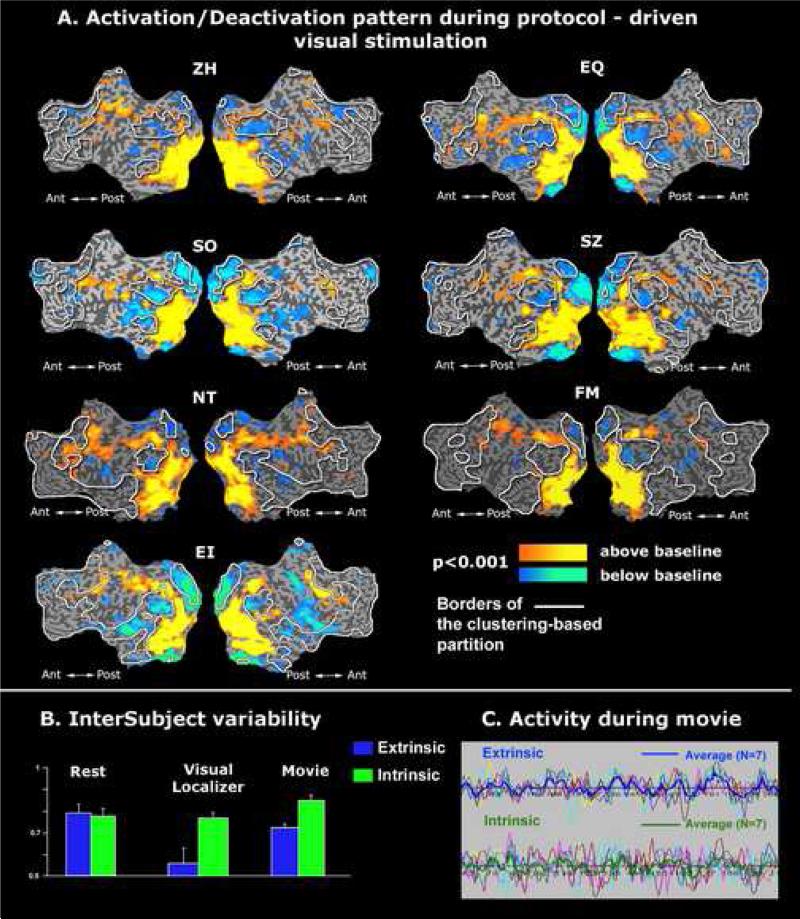
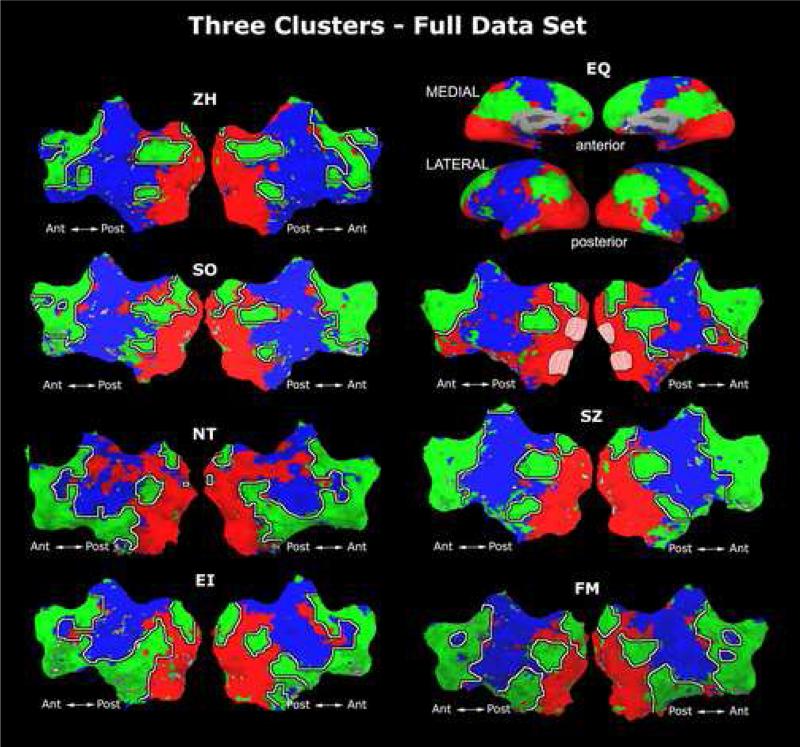
Global organizational principles are critical for understanding cortical functionality. Recently, we proposed a global sub-division of the posterior cortex into two large-scale systems. One system, labeled extrinsic, comprises the sensory-motor cortex, and is associated with the external environment. The second system, labeled intrinsic, overlaps substantially with the previously described "default-mode" network, and is likely associated with inner-oriented processing. This global partition of the cerebral cortex emerged from hemodynamic imaging data the analysis of which was constrained by pre-determined hypotheses. Here we applied a hypothesis-free, unsupervised two-class clustering algorithm (k-means) to a large set of fMRI data. The two clusters delineated by this unsupervised hypothesis-free procedure showed high anatomical consistency across individuals, and their cortical topography coincided largely with the previously determined extrinsic and intrinsic systems. These new clustering-based results confirm that the intrinsic-extrinsic subdivision constitutes a fundamental cortical divide.


Figures

Figure 1
Figure 1. The topography of clustering-based two-systems partition of cortical space
Individual clustering into two global systems, presented on unfolded cortical hemispheres for each subject. Clustering results for subject ZH are presented on an inflated and unfolded cortex (left upper corner). Borders of the intrinsic system from Golland et al., 2007 are marked by white lines for comparison. Note the strong anatomical agreement between the clustering results of the current analysis and the results from the previous study, despite the differences in the experimental setup and methodology. SFS: superior frontal sulcus; IFS: inferior frontal sulcus; CS: central sulcus; LS: lateral sulcus; IPS: intra-parietal sulcus; STS: superior temporal sulcus; ITS: inferior temporal sulcus; PCing: posterior cingulate.
Figure 2
Figure 2. Group-level consistency map
In the group consistency map for a particular network, each voxel was assigned the value of the proportion (P) of subjects whose individual clustering maps associated this voxel with the network of interest. The color depicts the strength of agreement (proportion) in clustering across subjects with respect to the selected network. Dark colors mark regions of full agreement (P=1) among individual results. Maps are presented on inflated (top) and unfolded left (LH) and right (RH) hemispheres.
Figure 3
Figure 3
(A) Activations and Deactivations during visual stimulation. Activation (orange-yellow) and deactivation (blue-green) maps in concatenated series of visual experiments presented individually for each subject (fixed effect, p<0.001, uncorrected). The borders of the clustering-based partition are shown as white lines. Note that many regions within the intrinsic network undergo deactivation during visual stimulation. Additional patches of deactivation can be observed in the auditory and language related areas, likely due to the purely visual nature of stimulation. (B) Inter-subject variability of averaged activity in the extrinsic and intrinsic networks. During sensory stimulation (Visual Localizer and Movie), but not during rest state, the variability of activation in the extrinsic system across subjects (blue bars) is substantially lower than that in the intrinsic system (green bars), reflecting the decoupling of the intrinsic system's activity from the external stimulation. (C) Time course of activity in individual subjects, averaged over the entire extrinsic and intrinsic networks, during movie presentation. The activity within the extrinsic system (upper panel) is more consistent across subjects than the activity within the intrinsic system (bottom panel) during presentation of continuous audio-visual movie.
Figure 4
Figure 4. The topography of clustering-based three-systems partition of cortical space
Individual clustering into three global systems, presented on unfolded cortical hemispheres for each subject. Clustering results for subject EQ are presented on an inflated and unfolded cortex (right upper corner). In addition, in this subject, visual retinotopic borders are delineated by light color on the unfolded cortical map. Borders of the intrinsic system from Figure 1 (k=2) are marked by white lines for comparison. Note that while the Intrinsic system borders show strong agreement with k=2 results, the Extrinsic system is further subdivided into visual areas and the rest.
Figure 5
Figure 5. Comparison with other studies
Summary of the default-mode/intrinsic activity obtained from Talairach coordinates reported in 7 different studies. The group consistency map of the intrinsic network is presented for two levels of consistency: P=0.75, marked in green; P=1, marked in dotted lines. Note the substantial agreement of the intrinsic network topography with other related studies.

References

    1. Amedi A, Malach R, Pascual-Leone A. Negative BOLD differentiates visual imagery and perception. Neuron. 2005;48(5):859–872. - PubMed
    1. Arieli A, Sterkin A, Grinvald A, Aertsen A. Dynamics of ongoing activity: explanation of the large variability in evoked cortical responses. Science. 1996;273(5283):1868–1871. - PubMed
    1. Arndt S, Cizadlo T, O'Leary D, Gold S, Andreasen NC. Normalizing counts and cerebral blood flow intensity in functional imaging studies of the human brain. Neuroimage. 1996;3(3 Pt 1):175–184. - PubMed
    1. Bartels A, Zeki S. Brain dynamics during natural viewing conditions-A new guide for mapping connectivity in vivo. Neuroimage. 2005;24(2):339–349. - PubMed
    1. Baumgartner R, Scarth G, Teichtmeister C, Somorjai R, Moser E. Fuzzy clustering of gradient-echo functional MRI in the human visual cortex. Part I: reproducibility. J Magn Reson Imaging. 1997;7(6):1094–1101. - PubMed

Publication types