

Where have all the interactions gone? Estimating the coverage of two-hybrid protein interaction maps
- PMID: 18039026
- PMCID: PMC2082503
- DOI: 10.1371/journal.pcbi.0030214
Where have all the interactions gone? Estimating the coverage of two-hybrid protein interaction maps
Abstract
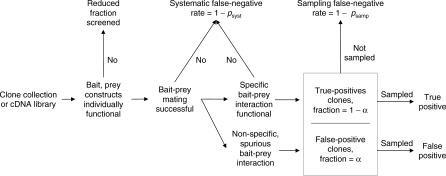
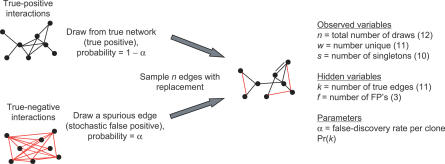
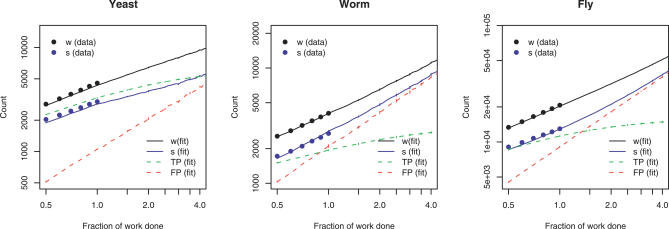
Yeast two-hybrid screens are an important method for mapping pairwise physical interactions between proteins. The fraction of interactions detected in independent screens can be very small, and an outstanding challenge is to determine the reason for the low overlap. Low overlap can arise from either a high false-discovery rate (interaction sets have low overlap because each set is contaminated by a large number of stochastic false-positive interactions) or a high false-negative rate (interaction sets have low overlap because each misses many true interactions). We extend capture-recapture theory to provide the first unified model for false-positive and false-negative rates for two-hybrid screens. Analysis of yeast, worm, and fly data indicates that 25% to 45% of the reported interactions are likely false positives. Membrane proteins have higher false-discovery rates on average, and signal transduction proteins have lower rates. The overall false-negative rate ranges from 75% for worm to 90% for fly, which arises from a roughly 50% false-negative rate due to statistical undersampling and a 55% to 85% false-negative rate due to proteins that appear to be systematically lost from the assays. Finally, statistical model selection conclusively rejects the Erdös-Rényi network model in favor of the power law model for yeast and the truncated power law for worm and fly degree distributions. Much as genome sequencing coverage estimates were essential for planning the human genome sequencing project, the coverage estimates developed here will be valuable for guiding future proteomic screens. All software and datasets are available in and , -, and -, and are also available from our Web site, http://www.baderzone.org.
Conflict of interest statement
Figures
References
-
- Phizicky E, Bastiaens PI, Zhu H, Snyder M, Fields S. Protein analysis on a proteomic scale. Nature. 2003;422:208–215. - PubMed
-
- Uetz P, Giot L, Cagney G, Mansfield TA, Judson RS, et al. A comprehensive analysis of protein–protein interactions in Saccharomyces cerevisiae. Nature. 2000;403:623–627. - PubMed
-
- Giot L, Bader JS, Brouwer C, Chaudhuri A, Kuang B, et al. A protein interaction map of Drosophila melanogaster. Science. 2003;302:1727–1736. - PubMed
Publication types
MeSH terms
Grants and funding
LinkOut - more resources
Full Text Sources
Other Literature Sources
Molecular Biology Databases
